suppa2繼續測試,這個軟件真的非常好用,速度很快、文檔清晰、使用方便。
suppa核心文件:
- https://github.com/comprna/SUPPA
- ~/references/SUPPA2/ref/hg19
- Homo_sapiens.GRCh37.75.formatted.gtf
- ensembl_hg19.events.ioe
分析步驟小結:
- 用salmon快速比對,reference是轉錄本fasta文件,得到的是每個轉錄本的TPM;
- 根據gtf文件構建AS events,分類清晰,主流標准【science paper為證】;
- 根據suppa自己的算法,由TPM矩陣和AS events得到每個AS event的PSI矩陣;
算法清晰,就是TPM的比值,PSI也是比值

AS event闡述清晰,格式明確
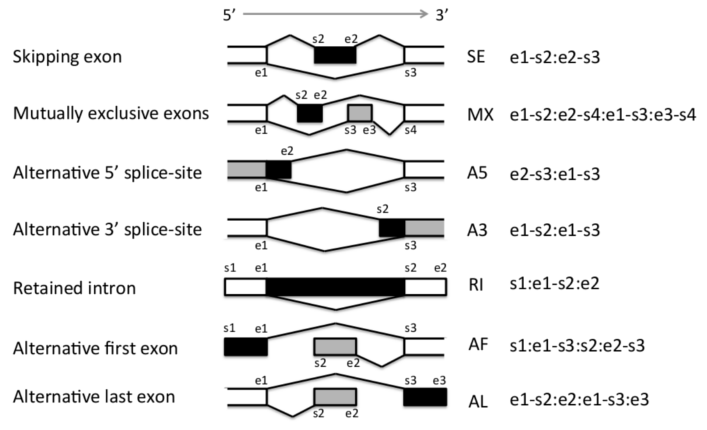
舉例:
# 一個AF event
# ENSG00000011304;AF:chr19:797452:797505-799413:798428:798545-799413:+
# PSI的計算方法
# ENST00000394601 ENST00000394601,ENST00000587094
可視化:toolTesting/AS_and_isoforms_checking.ipynb

關於方向:
目前AS event里的skipping和exon都搞明白,沒有歧義了,那方向呢?怎么確定哪個isoform是我計算的那個PSI的分子?【非常重要】
看AS event的定義,第一個就是分子:ENST00000394601 ENST00000394601,ENST00000587094
ENST00000394601特有的那個exon就是分子,在畫kartoon圖的時候應該放在下面。
ggplot畫gene structure和alternative splicing | ggbio | GenomicFeatures
至此,AS分析的所有細節已經全部明確,感受一下數據之美!
在測試的一個工具:SUPPA2
https://github.com/comprna/SUPPA
測試代碼:
salmon快速比對,得到exon TPM
source activate splicing
salmon index -t  gencode.v37.transcripts.fa  -i   gencode.v37.transcripts.salmon.index
salmon index -t hg19_EnsenmblGenes_sequence_ensenmbl.fasta -i Ensembl_hg19_salmon_index
# source activate splicing

# hg38
index=~/references/SUPPA2/ref/GRCh38/gencode.v37.transcripts.salmon.index/
# hg19
# index=~/references/SUPPA2/ref/hg19/Ensembl_hg19_salmon_index/

for i in `ls merged.fastq/*.list0*`
#for i in `ls merged.fastq/{IMR90.list*,17C8.list*}`
do
        echo $i &&\
        cut -d, -f2 $i | xargs zcat > ${i}_1.fastq &&\
        cut -d, -f3 $i | xargs zcat > ${i}_2.fastq &&\
        # gzip fastq/${i}_1.fastq fastq/${i}_2.fastq &&\
        ~/softwares/anaconda3/envs/splicing/bin/salmon quant -i $index  -l ISF --gcBias -1 ${i}_1.fastq -2 ${i}_2.fastq -p 10 -o ${i}_output &&\
        rm ${i}_1.fastq ${i}_2.fastq &&\
        echo "done"
done
suppa后續分析
#####################################################
# suppa analysis
~/project/scRNA-seq/rawData/smart-seq/analysis/suppa/
# index folder
~/references/SUPPA2/ref/hg19/Ensembl_hg19_salmon_index/
# prepare annotation of AS events
python ~/softwares/SUPPA/suppa.py generateEvents -i Homo_sapiens.GRCh37.75.formatted.gtf -o ensembl_hg19.events -e SE SS MX RI FL -f ioe

awk '
    FNR==1 && NR!=1 { while (/^<header>/) getline; }
    1 {print}
' *.ioe > ensembl_hg19.events.ioe

# merge TPM
python ~/softwares/SUPPA/multipleFieldSelection.py -i merged.fastq/*_output/quant.sf -k 1 -f 4 -o iso_tpm.txt

# format the rowname
# error: non-unique values when setting 'row.names': ‘ENSG00000000003.15’, ‘ENSG00000000005.6’
# modify ~/softwares/SUPPA/scripts/format_Ensembl_ids.R
# ids <- unlist(lapply(rownames(file),function(x)strsplit(x,"\\|")[[1]][1]))
Rscript ~/softwares/SUPPA/scripts/format_Ensembl_ids.R iso_tpm.txt


# get PSI values
# hg19
python ~/softwares/SUPPA/suppa.py psiPerEvent -i ~/references/SUPPA2/ref/hg19/ensembl_hg19.events.ioe -e iso_tpm_formatted.txt -o HSCR_events
# hg38
python ~/softwares/SUPPA/suppa.py psiPerEvent -i ~/references/SUPPA2/ref/GRCh38/gencode.v37.all.events.ioe -e iso_tpm_formatted.txt -o HSCR_events

# error - skip some AS events
ERROR:psiCalculator:transcript ENST00000484026.6_PAR_Y not found in the "expression file".
ERROR:psiCalculator:PSI not calculated for event ENSG00000169100.14_PAR_Y;SE:chrY:1389727-1390192:1390293-1391899:-.

# PKM MX
ENSG00000067225;MX:chr15:72492996-72494795:72494961-72499069:72492996-72495363:72495529-72499069:-

# qPCR testing samples
IMR90.list 17C8.list

# PKM result
event     X17C8.list00_output     X17C8.list01_output     X17C8.list02_output     X17C8.list03_output     X17C8.list04_output     IMR90.list00_output     IMR90.list01_output     IMR90.list02_output     IMR90.list03_output     IMR90.list04_output
ENSG00000067225.19;MX:chr15:72200655-72202454:72202620-72206728:72200655-72203022:72203188-72206728:-   0.9220111807188586      0.9218209128593989      0.9369499000184589      0.9371596717647238      0.9437735074216145      0.9358327299524112      0.9162359515407531      0.9017577693324474      0.9236993945732118      0.9051320273934063
最好用最新的hg38的注釋(genecode v37),否則AS數據會非常不全。
suppa這個工具還是不錯的,AS的種類豐富,結果也比較靠譜。
發現一個課題組,已經在AS分析上做了大量的工作,值得學習。
- VAST-TOOLS - GitHub
- VastDB - An atlas of alternative splicing profiles in vertebrate cell and tissue types
- Matt - A Unix toolkit for analyzing genomic sequences with focus on down-stream analysis of alternative splicing events
通過可視化工具了解的信息【不會可視化,你就永遠都看不懂結果】:
junction:從一個exon的結束到另一個exon的起點,這就是一個junction,俗稱跳躍點、接合點,因為這兩個點注定要連在一起。
AS event:一個可變剪切的時間,如何定義呢,一個exon,以及三個junction即可定義,要滿足等式相等原則,即一個exon的exclusion。
核心需求:
- 單細胞的整體PSI分析【whole genome】
- 單細胞、bulk的特定的exon的PSI value【outrigger】
- target gene exon PSI value
- 單細胞、bulk的特定的exon的表達值
重點看:
index: Build a de novo splicing annotation index of events custom to your data
Google search:get PSI value for one exon【PSI值沒那么好算,最好把它底層的邏輯搞懂】
PSI,非常簡單明確,就是inclusion reads / (inclusion reads + exclusion reads)
inclusion reads比較明確,按single end來看,凡事比對到目標exon的reads都算作inclusion reads;
exclusion reads則沒那么直接,不是所有的減去inclusion reads,而是跳過目標exon的reads,其他不相干的reads都不算;

https://github.com/JY-Zhou/FreePSI
http://projects.insilico.us.com/TCGASpliceSeq/faq.jsp
根據bulk RNA-seq或者single-cell RNA-seq來找isoform的類型。【難點:二代NGS的reads長度較短,可能無法成功組裝出full-length的isoform。】
我們只需要關注junction read,基數即可。
junction read:在成熟mRNA中,測序的reads如果同時跨越了兩個exon,則為junction read。
如何提取出junction read?【不靠譜,用outrigger,里面有個reads.csv文件】
/home/lizhixin/softwares/regtools/build/regtools junctions extract -r chr19:797075-812327 -s 0 UE.bam
自己寫一個程序吧,用bedtools coverage這個功能。
bedtools coverage -a regions.bed -b reads.bam
spliceGraph
核心就是count reads,同時比對到兩個點上。【這個不難,但是並不能說明問題】
samtools view -u -@ 2 UE.bam chr19:803636-803636 | less -S
必須鑒定出拼接兩個exon的read,這樣的才是有意義的證據,單純的連接的數據並不實用【中間可能插入了很多個exon,連接≠拼接】。
cat gencode.v27.annotation.gtf | grep "\"PKM\"" | awk '{if($3=="exon")print $0}' > PKM.txt
samtools view -b -@ 2 23c9.bam chr19:797075-812327 > PTBP1.23c9.bam
參考:
Question: Count Junctions In A Sam/Bam File
Question: How Many Reads In A Bam File Are Aligned To a Specific Region