新冠疫情來臨,我簡單的做一次疫情的數據分析溫習我的python知識,也希望能幫到各位。分析中我用到的技術有:pyton爬取數據html+css將分析結果排版。用到的工具有excel+tableau進行數據處理分析和繪圖。數據分析中還是存在很多的不足,很多地方有待提高,希望大家多多交流。
首先,我們要獲取到數據,本次數據分析所需要的疫情數據來自https://ncov.dxy.cn。通過對網站的分析有世界的疫情數據和中國的疫情數據,所以我們要分別爬取到世界和全國的疫情數據。

好了,接下來廢話不多說,為了更直觀的了解數據爬取的過程,我把爬取世界疫情數據、爬取全國的疫情數據分開來寫,雖然有很多相同的代碼,不過能更好的理解數據獲取的過程。
爬取世界疫情數據的代碼:
    import json
    import requests
    import pandas as pd
    from bs4 import BeautifulSoup
    url = 'https://ncov.dxy.cn/ncovh5/view/pneumonia?from=timeline&isappinstalled=0'
    headers = {
        'user-agent': 'Mozilla/5.0 (Windows NT 10.0; WOW64) AppleWebKit/537.36 (KHTML, like Gecko) Chrome/74.0.3729.131 Safari/537.36'
        }
    response = requests.get(url,headers = headers)
    response.encoding = 'utf-8'
    content = response.content.decode('utf-8')#以字節流形式打印網頁源碼
    soup = BeautifulSoup(response.text,'lxml')
    #爬取選擇網頁文檔的內容
    data = soup.find_all(name = 'script',attrs = {'id':'getListByCountryTypeService2true'})
    #轉為字符串
    account = str(data)
    account1 = account[95:-21]#切片截取從52到后面倒數21取到需要的數據
    account1_json = json.loads(account1)


    #提取數據到列表
    id = []
    continents = []
    provinceName = []
    currentConfirmedCount = []
    confirmedCount = []
    confirmedCountRank = []
    suspectedCount = []
    curedCount = []
    deadCount = []
    deadCountRank = []
    deadRate = []
    deadRateRank = []
    print(len(account1_json))
    i=0
    for a in account1_json:
        if 'id' in a:
            id.append(a['id'])
        else:
            id.append('沒有')
        continents.append(a['continents'])
        provinceName.append(a['provinceName'])
        currentConfirmedCount.append(a['currentConfirmedCount'])
        confirmedCount.append(a['confirmedCount'])
        if 'confirmedCountRank' in a:
            confirmedCountRank.append(a['confirmedCountRank'])
        else:
            confirmedCountRank.append('沒有')
        suspectedCount.append(a['suspectedCount'])
        curedCount.append(a['curedCount'])
        deadCount.append(a['deadCount'])
        if 'deadCountRank' in a:
            deadCountRank.append(a['deadCountRank'])
        else:
            deadCountRank.append('沒有')
        if 'deadRate' in a:
            deadRate.append(a['deadRate'])
        else:
            deadRate.append('沒有')
        if 'deadRateRank' in a:
            deadRateRank.append(a['deadRateRank'])
        else:
            deadRateRank.append('沒有')

    #轉換成pandas數組
    df = {
        'id':pd.Series(id),
        '所在大洲':pd.Series(continents),
        '城市':pd.Series(provinceName),
        '當前確診':pd.Series(currentConfirmedCount),
        '累計確診':pd.Series(confirmedCount),
        '確診排名':pd.Series(confirmedCountRank),
        '疑似病例':pd.Series(suspectedCount),
        '治愈人數':pd.Series(curedCount),
        '死亡人數':pd.Series(deadCount),
        '死亡人數排名':pd.Series(deadCountRank),
        '死亡率':pd.Series(deadRate),
        '死亡率排名':pd.Series(deadRateRank)
    }
    pds = pd.DataFrame(df)
    pds.to_excel('1.xlsx', index=False)
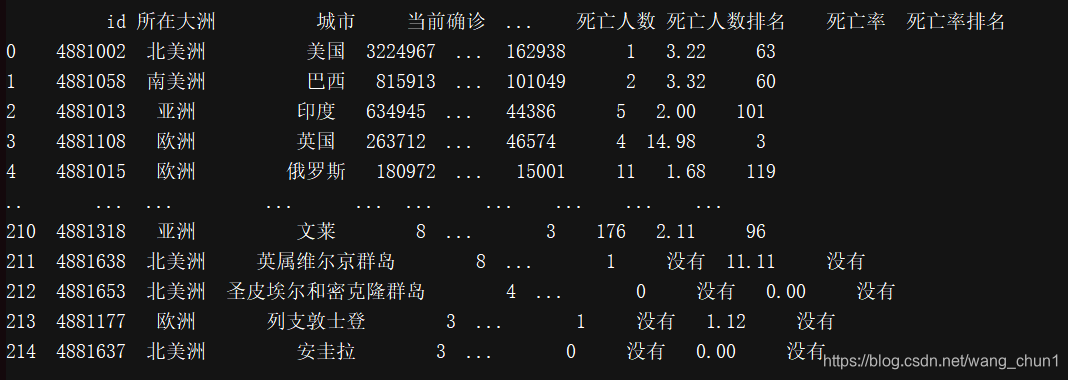
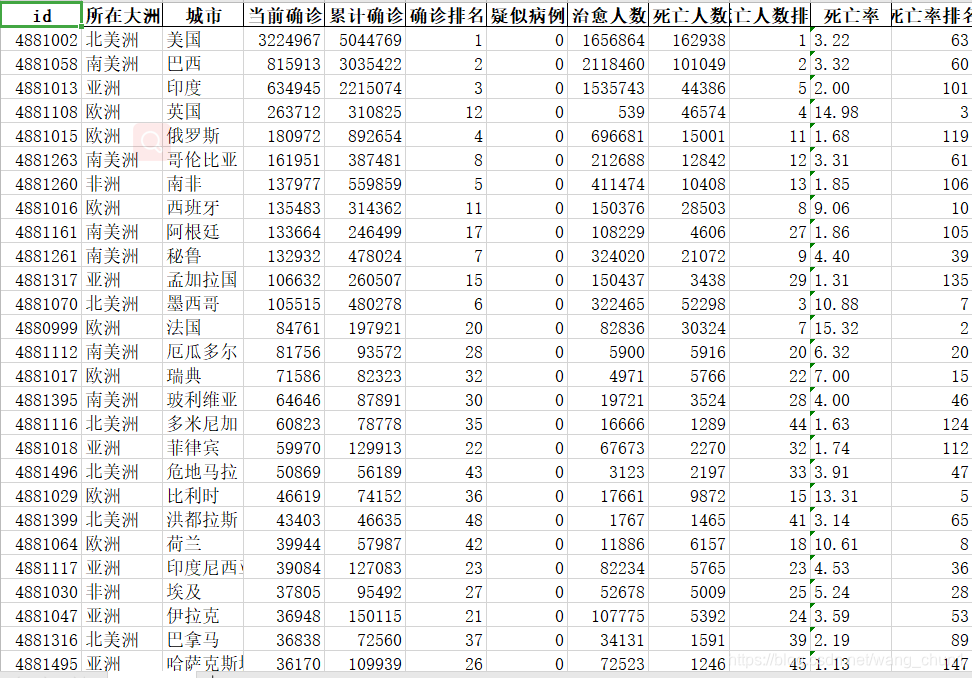
以上代碼我將數據爬取后用pandas處理過后並寫到表格文件里:
國內疫情數據的爬取:
    import requests
    import pandas as pd
    from bs4 import BeautifulSoup
    import re
    url = 'https://ncov.dxy.cn/ncovh5/view/pneumonia?from=timeline&isappinstalled=0'
    headers = {
        'user-agent': 'Mozilla/5.0 (Windows NT 10.0; WOW64) AppleWebKit/537.36 (KHTML, like Gecko) Chrome/74.0.3729.131 Safari/537.36'
        }
    #省級正則表達式
    provinceName_re = re.compile(r'"provinceName":"(.*?)",')
    provinceShortName_re = re.compile(r'"provinceShortName":"(.*?)",')
    currentConfirmedCount_re = re.compile(r'"currentConfirmedCount":(.*?),')
    confirmedCount_re = re.compile(r'"confirmedCount":(.*?),')
    suspectedCount_re = re.compile(r'"suspectedCount":(.*?),')
    curedCount_re = re.compile(r'"curedCount":(.*?),')
    deadCount_re = re.compile(r'"deadCount":(.*?),')
    comment_re = re.compile(r'"comment":"(.*?)",')
    locationId_re = re.compile(r'"locationId":(.*?),')
    statisticsData_re = re.compile(r'"statisticsData":"(.*?)",')
    cities_re = re.compile(r'"cities":\[\{(.*?)\}\]')

    #市級正則表達式
    cityName_re = re.compile(r'"cityName":"(.*?)",')
    currentConfirmedCount_1_re = re.compile(r'"currentConfirmedCount":(.*?),')
    confirmedCount_1_re = re.compile(r'"confirmedCount":(.*?),')
    suspectedCount_1_re = re.compile(r'"suspectedCount":(.*?),')
    curedCount_1_re = re.compile(r'"curedCount":(.*?),')
    deadCount_1_re = re.compile(r'"deadCount":(.*?),')
    locationId_1_re = re.compile(r'"locationId":(.*?)\},')

    #爬蟲爬取數據
    datas = requests.get(url,headers = headers)
    datas.encoding = 'utf-8'
    soup = BeautifulSoup(datas.text,'lxml')
    data = soup.find_all('script',{'id':'getAreaStat'})
    data = str(data)
    data_str = data[54:-23]

    #替換字符串內容,避免重復查找
    citiess = re.sub(cities_re,'8888',data_str)
    #查找省級數據
    provinceNames = re.findall(provinceName_re,citiess)
    provinceShortNames = re.findall(provinceShortName_re,citiess)
    currentConfirmedCounts = re.findall(currentConfirmedCount_re,citiess)
    confirmedCounts = re.findall(confirmedCount_re,citiess)
    suspectedCounts = re.findall(suspectedCount_re,citiess)
    curedCounts = re.findall(curedCount_re,citiess)
    deadCounts = re.findall(deadCount_re,citiess)
    comments = re.findall(comment_re,citiess)
    locationIds = re.findall(locationId_re,citiess)
    statisticsDatas = re.findall(statisticsData_re,citiess)


    #查找市級數據
    citiess_str1 = re.findall(cities_re,data_str)
    #將市級列表數據轉為字符串,方便正則表達式查找
    citiess_str = str(citiess_str1)
    cityName = re.findall(cityName_re,citiess_str)
    currentConfirmedCount_1 = re.findall(currentConfirmedCount_1_re,citiess_str)
    confirmedCount_1 = re.findall(confirmedCount_1_re,citiess_str)
    suspectedCount_1 = re.findall(suspectedCount_1_re,citiess_str)
    curedCount_1 = re.findall(curedCount_1_re,citiess_str)
    deadCount_1 = re.findall(deadCount_1_re,citiess_str)

    # 省級數據轉換為pandas數組
    df = {
        '地區代碼':pd.Series(locationIds),
        '省':pd.Series(provinceNames),
        '省區短名':pd.Series(provinceShortNames),
        '當前確診':pd.Series(currentConfirmedCounts),
        '累計確診':pd.Series(confirmedCounts),
        '疑似確診':pd.Series(suspectedCounts),
        '治愈人數':pd.Series(curedCounts),
        '死亡人數':pd.Series(deadCounts),
        '評論':pd.Series(comments),
        '統計數據區':pd.Series(statisticsDatas),
    }
    pds = pd.DataFrame(df)
    pds.to_excel('國內疫情統計表1.xlsx',index=True)
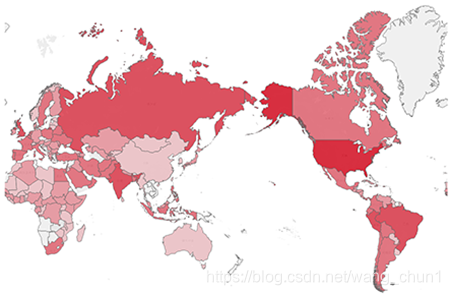
獲取數據后用Excel進行簡單的處理,並和tableau一起將結果繪制成圖像。下圖是幾張成果圖:
世界疫情熱點地圖:
國內疫情熱點地圖: 
將獲取處理過的數據可視化以后還差形成報告分析的形式,編寫報告的方式很多,不過我選擇的是用前端網頁的形式呈現出來。這種的方法的優點是:排版的效果更好,更直觀,可以自己通過編寫代碼的形式自己設計想要的排版格式;缺陷是不可打印,難度較大,需要對html和css有一定的基礎。一下是成品圖:
最近收到許多網友的消息,需要這份數據,不過遺憾的是本人比較少看信息,導致不能及時的回復各位。所以我最近整理了本次新冠疫情的全部數據,包括最近的新冠疫情數據,數據分析的結果圖表(動態圖表,即用鼠標滑過圖表某個區域便會顯示出該區域的具體數據),全部源碼。需要的網友到
新冠疫情全部數據下載

