前言
在開始監控你的服務之前,你需要通過添加prometheus客戶端來添加監控。
可以找 第三方exporter 監控你的服務,也可以自己編寫exporter。
目前已經有很多不同的語言編寫的客戶端庫,包括官方提供的Go,Java,Python,Ruby。
已有客戶端庫
在了解編寫exporter之前,可以先5分鍾學會搭建prometheus
簡單的exporter服務
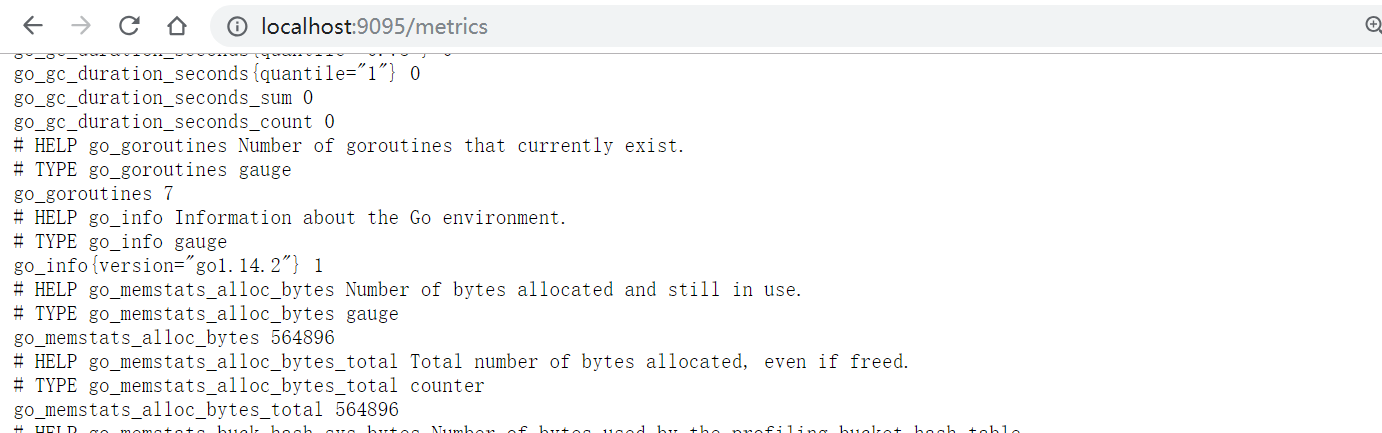
先寫一個簡單的http服務,在9095端口啟動了一個能夠為prometheus提供監控指標的HTTP服務。你可以在 http://localhost:9095/metrics 看到這些指標。
package main

import (
	"github.com/prometheus/client_golang/prometheus/promhttp"
	"net/http"
)

func main() {
	http.HandleFunc("/", func(w http.ResponseWriter, r *http.Request) {
		w.Write([]byte("hello world"))
	})
	http.Handle("/metrics",promhttp.Handler())
	http.ListenAndServe(":9095",nil)
}
雖然偶爾會手動訪問/metrics頁面查看指標數據,但是將指標數據導入prometheus才方便。
global:
  scrape_interval: 15s # 默認抓取間隔,15s向目標抓取一次數據
  external_labels:
    monitor: 'prometheus-monitor'
# 抓取對象
scrape_configs:
  - job_name: 'exporter' # 名稱,會在每一條metrics添加標簽{job_name:"prometheus"}
    scrape_interval: 5s # 抓取時間
    static_configs: # 抓取對象
      - targets: ['localhost:9095']
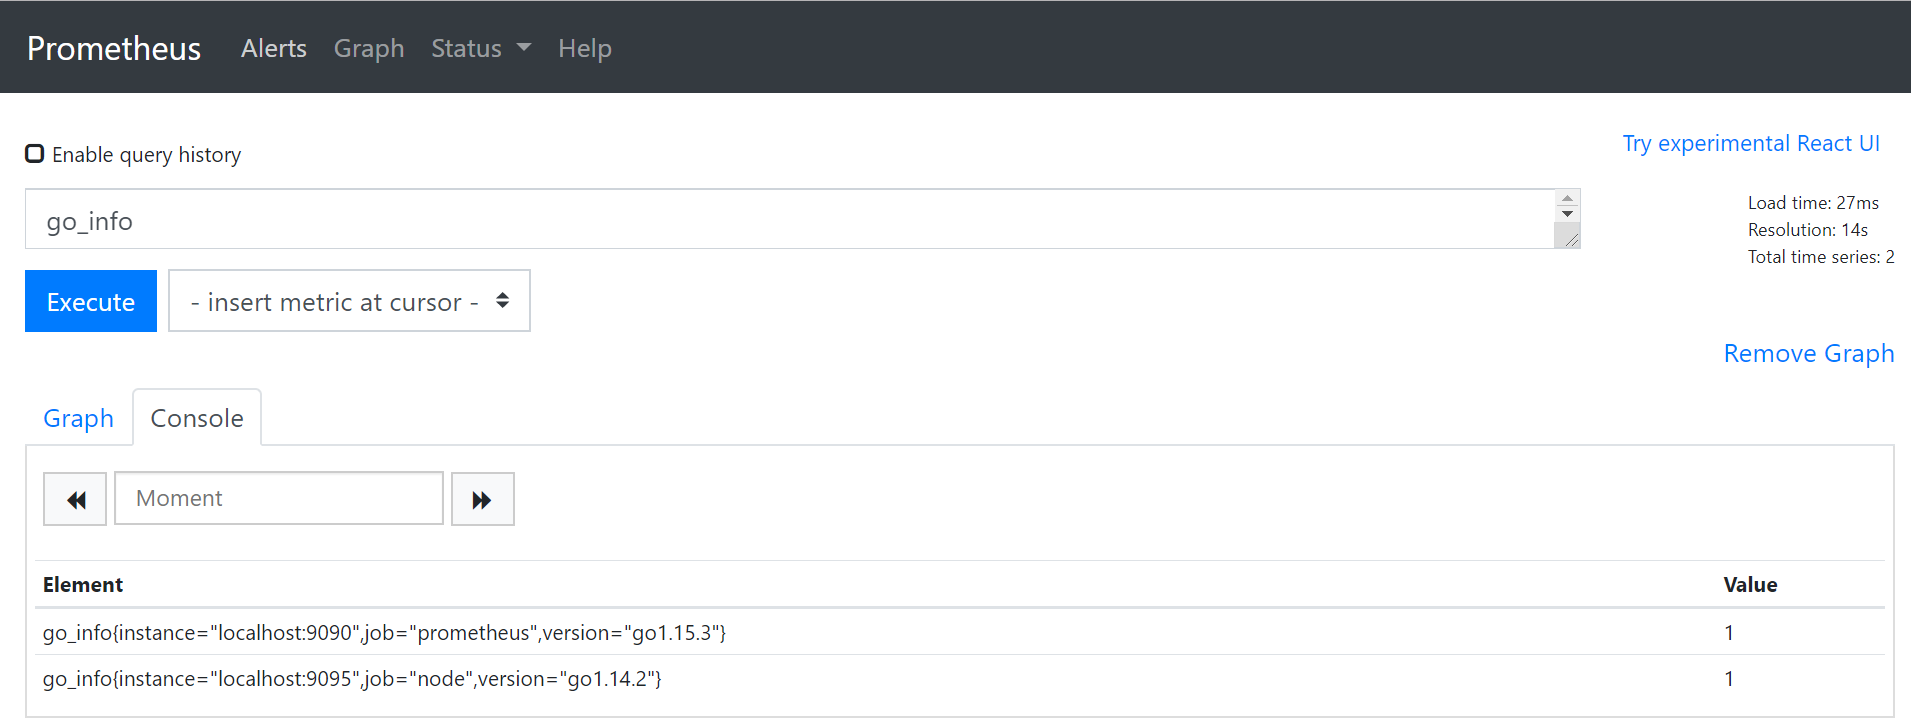
那么在 http://localhost:9090/ 瀏覽器輸入 PromQL 表達式 go_info,就會看到如圖的結果
監控指標
Counter(計數器類型)
Counter記錄的是事件的數量或大小,只增不減,除非發生重置。
Counter主要有兩個方法
# 將counter加1
Inc()
# 增加指定值,如果<0會panic
Add(float64)
package main

import (
	"github.com/prometheus/client_golang/prometheus"
	"github.com/prometheus/client_golang/prometheus/promauto"
    "github.com/prometheus/client_golang/prometheus/promhttp"
	"net/http"
	"time"
)

var (
	failures = prometheus.NewCounterVec(prometheus.CounterOpts{
		Name: "hq_failture_total",
		Help: "failure counts",
	},[]string{"device"})
    // 可以使用promauto自動注冊
    success = promauto.NewCounterVec(prometheus.CounterOpts{
    	Name: "hq_failture_total",
    	Help: "failure counts",
    },[]string{"device"})
)

func init() {
	prometheus.MustRegister(failures)
}

func main() {
	go func() {
		failures.WithLabelValues("/dev/sda").Add(3.2)
		time.Sleep(time.Second)
		failures.WithLabelValues("/dev/sda").Inc()
		time.Sleep(time.Second)
		failures.WithLabelValues("/dev/sdb").Inc()
		time.Sleep(time.Second)
		failures.WithLabelValues("/dev/sdb").Add(1.5)
	}()

	http.HandleFunc("/", func(w http.ResponseWriter, r *http.Request) {
		w.Write([]byte("hello world"))
	})
	http.Handle("/metrics",promhttp.Handler())
	http.ListenAndServe(":9095",nil)
}
Gauge(儀表盤類型)
Gauge是可增可減的指標類,更關注於數值本身。
Gauge主要有幾種方法
# 設置任意值
Set(float64)
# 加1
Inc()
# 減1
Dec()
# 加任意數,如果是負數,那么就會減去
Add(float64)
# 和當前值的差值
Sub(float64)
# 設置值為當前時間戳
SetToCurrentTime()
package main

import (
	"github.com/prometheus/client_golang/prometheus"
	"github.com/prometheus/client_golang/prometheus/promhttp"
	"net/http"
	"time"
)

var (
	failures = prometheus.NewGaugeVec(prometheus.GaugeOpts{
		Name: "hq_failture_total",
		Help: "failure counts",
	},[]string{"device"})
)

func init() {
	prometheus.MustRegister(failures)
}

func main() {
	go func() {
		failures.WithLabelValues("/dev/sda").Add(5)
		failures.WithLabelValues("/dev/sdb").Set(10)
		time.Sleep(time.Second * 5)
		failures.WithLabelValues("/dev/sda").Inc()
		failures.WithLabelValues("/dev/sdb").Add(3)
		time.Sleep(time.Second * 5)
		failures.WithLabelValues("/dev/sda").Dec()
		failures.WithLabelValues("/dev/sdb").SetToCurrentTime()
		time.Sleep(time.Second* 5)
		failures.WithLabelValues("/dev/sda").Sub(1)
		failures.WithLabelValues("/dev/sdb").Dec()
		time.Sleep(time.Second* 5)


		time.Sleep(time.Second)

	}()

	http.HandleFunc("/", func(w http.ResponseWriter, r *http.Request) {
		w.Write([]byte("hello world"))
	})
	http.Handle("/metrics",promhttp.Handler())
	http.ListenAndServe(":9095",nil)
}
Summary(摘要類型)
表示一段時間數據采樣結果,由_count,_sum構成
Summary只有一種方法
Observe(float64)
你可以訪問 /metrics 可以看到hq_failture_total_sum和hq_failture_total_count
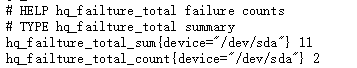
hq_failture_total_sum代表觀察值的總和
hq_failture_total_count代表觀察到的條數
package main

import (
	"github.com/prometheus/client_golang/prometheus"
	"github.com/prometheus/client_golang/prometheus/promhttp"
	"net/http"
	"time"
)

var (
	failures = prometheus.NewSummaryVec(prometheus.SummaryOpts{
		Name: "hq_failture_total",
		Help: "failure counts",
	},[]string{"device"})
)

func init() {
	prometheus.MustRegister(failures)
}

func main() {
	var count float64
	go func() {
		t := time.NewTicker(time.Second)
		for  {
			count++
			failures.WithLabelValues("/dev/sdc").Observe(count)
			<-t.C
		}
	}()

	http.HandleFunc("/", func(w http.ResponseWriter, r *http.Request) {
		w.Write([]byte("hello world"))
	})
	http.Handle("/metrics",promhttp.Handler())
	http.ListenAndServe(":9095",nil)
}
Histogram(直方圖類型)
summary可以提供平均延遲數據,但是如果你想要分位數呢?
那么就可以使用Histogram分位數.
Histogram只有一種方法
Observe(float64)
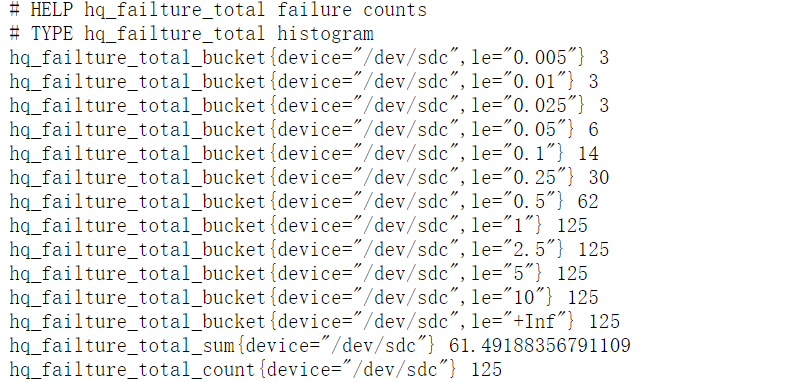
你可以訪問 /metrics 可以看到hq_failture_total_sum和hq_failture_total_count、hq_failture_total_bucket
package main

import (
	"github.com/prometheus/client_golang/prometheus"
	"github.com/prometheus/client_golang/prometheus/promhttp"
	"math/rand"
	"net/http"
	"time"
)

var (
	failures = prometheus.NewHistogramVec(prometheus.HistogramOpts{
		Name: "hq_failture_total",
		Help: "failure counts",
	},[]string{"device"})
)

func init() {
	prometheus.MustRegister(failures)
}

func main() {
	go func() {
		t := time.NewTicker(time.Second)
		for  {
			failures.WithLabelValues("/dev/sdc").Observe(rand.Float64())
			<-t.C
		}
	}()

	http.HandleFunc("/", func(w http.ResponseWriter, r *http.Request) {
		w.Write([]byte("hello world"))
	})
	http.Handle("/metrics",promhttp.Handler())
	http.ListenAndServe(":9095",nil)
}
那么什么是bucket(桶)?桶記錄小於監控指標的數量
默認的buckets范圍為{0.005,0.01,0.025,0.05,0.075,0.1,0.25,0.5,0.75,1,2.5,5,7.5,10}
PromQL函數histogram_quantile可以用來統計桶中的分位數。例如,0.95分位數的表達式為
histogram_quantile(0.95,rate(hq_failture_total_bucket[1m]))
如何給指標命名?
Prometheus 指標需要以字母開頭,后面可以跟着任意數量的字母,數字,下划線。
命名的整體結構是 library_name_unit_suffix
雖然 [a-zA-Z_:][a-zA-Z0-9_:]* 是Prometheus中有效的命名規則的正則表達式,但你要避免是有某些有效值。
你不應該在測控指標使用冒號,因為它是為記錄規則中使用而保留的。以下划線開頭的名稱是為prometheus內部使用而保留的。
_total,_count,_sum和_bucket這些后綴是留給counter,summary和histogram指標使用的。
除了在counter類型的指標上始終具有_total后綴外,不要將其他后綴放在指標名稱的末尾。