介紹
在本教程中,您將探索幾種用於鄰近度分析的技術。 特別是,您將學習如何執行以下操作:
- 測量地圖上點之間的距離,以及
- 選擇某要素半徑內的所有點。
import folium
from folium import Marker, GeoJson
from folium.plugins import HeatMap

import pandas as pd
import geopandas as gpd
您將使用來自美國環境保護署(EPA)的數據集,該數據集跟蹤美國賓夕法尼亞州費城的有毒化學物質的釋放。
releases = gpd.read_file("../input/geospatial-learn-course-data/toxic_release_pennsylvania/toxic_release_pennsylvania/toxic_release_pennsylvania.shp")
releases.head()


您還將使用包含來自同一城市的空氣質量監測站的讀數的數據集。
stations = gpd.read_file("../input/geospatial-learn-course-data/PhillyHealth_Air_Monitoring_Stations/PhillyHealth_Air_Monitoring_Stations/PhillyHealth_Air_Monitoring_Stations.shp")
stations.head()


Measuring distance(測量距離)
要測量來自兩個不同GeoDataFrame的點之間的距離,我們首先必須確保它們使用相同的坐標參考系統(CRS)。 幸運的是,這里就是這種情況,它們都使用EPSG 2272。
print(stations.crs)
print(releases.crs)
{'init': 'epsg:2272'}
{'init': 'epsg:2272'}
我們還檢查CRS,以查看其使用的單位(米,英尺或其他)。 在這種情況下,EPSG 2272具有英尺單位。 (如果您願意,可以在此處進行檢查。)
在GeoPandas中計算距離相對簡單。 下面的代碼單元計算出last_release中相對較新的版本事件與stationGeoDataFrame中的每個站點之間的距離(以英尺為單位)。
# Select one release incident in particular
recent_release = releases.iloc[360]

# Measure distance from release to each station
distances = stations.geometry.distance(recent_release.geometry)
distances
out:
0     44778.509761
1     51006.456589
2     77744.509207
3     14672.170878
4     43753.554393
5      4711.658655
6     23197.430858
7     12072.823097
8     79081.825506
9      3780.623591
10    27577.474903
11    19818.381002
dtype: float64
使用計算出的距離,我們可以獲得諸如到每個站點的平均距離之類的統計信息。
print('Mean distance to monitoring stations: {} feet'.format(distances.mean()))
Mean distance to monitoring stations: 33516.28487007786 feet
或者,我們可以找到最近的監測站。
print('Closest monitoring station ({} feet):'.format(distances.min()))
print(stations.iloc[distances.idxmin()][["ADDRESS", "LATITUDE", "LONGITUDE"]])
Closest monitoring station (3780.623590556444 feet):
ADDRESS      3100 Penrose Ferry Road
LATITUDE                     39.9128
LONGITUDE                   -75.1854
Name: 9, dtype: object
Creating a buffer(創建一個緩沖區)
如果我們想了解地圖上所有距某個點一定半徑的點,最簡單的方法是創建一個緩沖區。
下面的代碼單元創建一個GeoSeries two_mile_buffer,其中包含12個不同的Polygon對象。 每個多邊形是在不同的空氣監測站周圍2英里(或2 * 5280英尺)的緩沖區。
two_mile_buffer = stations.geometry.buffer(2*5280)
two_mile_buffer.head()
0    POLYGON ((2721944.640797138 257149.3104284704,...
1    POLYGON ((2682494.289907977 271248.9000113755,...
2    POLYGON ((2744886.638220146 280980.2466903776,...
3    POLYGON ((2703638.579968393 233247.1013432145,...
4    POLYGON ((2726959.772827223 251134.9763285518,...
dtype: object
我們使用`folium.GeoJson()`在地圖上繪制每個多邊形。 請注意,由於filium需要緯度和經度的坐標,因此在繪制之前必須將CRS轉換為EPSG 4326。
Create map with release incidents and monitoring stations
m = folium.Map(location=[39.9526,-75.1652], zoom_start=11)
HeatMap(data=releases[['LATITUDE', 'LONGITUDE']], radius=15).add_to(m)
for idx, row in stations.iterrows():
Marker([row['LATITUDE'], row['LONGITUDE']]).add_to(m)
Plot each polygon on the map
GeoJson(two_mile_buffer.to_crs(epsg=4326)).add_to(m)
Show the map
m

現在,要測試在**任何**監測站的2英里范圍內是否發生了有毒物質釋放,我們可以對每個多邊形運行12種不同的測試(以單獨檢查其是否包含該點)。

但是更有效的方法是先將所有多邊形折疊成一個**MultiPolygon**對象。 我們使用`unary_union`屬性來執行此操作。
Turn group of polygons into single multipolygon
my_union = two_mile_buffer.geometry.unary_union
print('Type:', type(my_union))
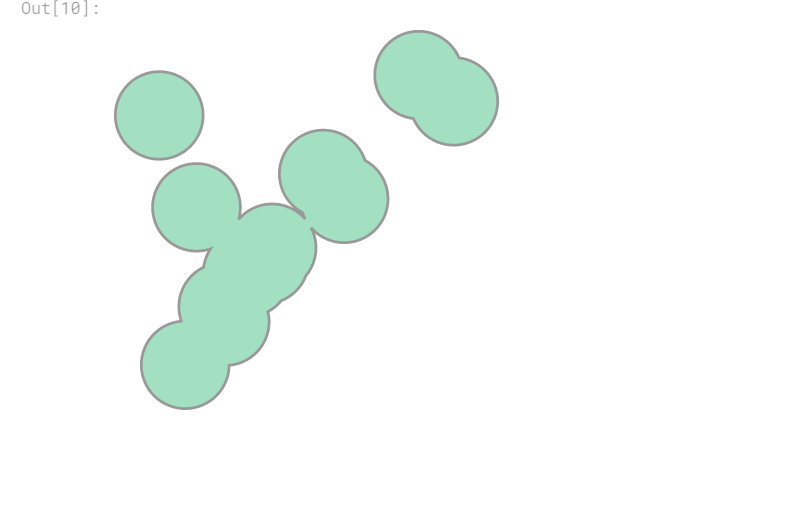
Show the MultiPolygon object
my_union
Type: <class 'shapely.geometry.multipolygon.MultiPolygon'>
我們使用`contains()`方法來檢查多邊形是否包含一個點。 我們將使用本教程前面部分中的發布事件,我們知道它離最近的監視站大約3781英尺。
The closest station is less than two miles away
my_union.contains(releases.iloc[360].geometry)
`out:True`
但是,並非所有的釋放都發生在空氣監測站的兩英里范圍內!
The closest station is more than two miles away
my_union.contains(releases.iloc[358].geometry)
`out:False`

# Your turn
在[最后的練習](https://www.kaggle.com/kernels/fork/5832147)中,您將調查紐約市的醫院覆蓋率。