之前寫過《使用SwingBench 對Oracle RAC DB性能 壓力測試》,使用的是最基礎直觀的圖形模式,已經可以滿足大多數需求。
但是在有些場景下,圖形模式可能本身消耗資源過大,尤其在生成大量測試數據時,很可能會由於圖形本身的不穩定導致卡死甚至直接中途退出,嚴重影響效率和測試體驗。
而如果采用靜默模式,直接使用xml編輯又不能很好的確認改的是否正確。
本文主要介紹下我在做某次壓力測試時發現的小技巧。
1.生成壓測數據
之前使用圖形界面時,我們直接去執行 ./oewizard 即可調用圖形界面按照提示一步步配置最終生成壓力測試的數據。而使用字符模式,則需要指定參數配置文件以及一些必要的參數,先來看都有哪些參數:
[oracle@db50 bin]$ ./oewizard -h
usage: parameters:
 -allindexes             build all indexes for schema
 -bigfile                use big file tablespaces
 -c <filename>           wizard config file
 -cl                     run in character mode
 -compositepart          use a composite paritioning model if it exisits
 -compress               use default compression model if it exists
 -create                 create benchmarks schema
 -cs <connectString>     connectring for database
 -dba <username>         dba username for schema creation
 -dbap <password>        password for schema creation
 -debug                  turn on debugging output
 -debugf                 turn on debugging output to file (debug.log)
 -df <datafile>          datafile name used to create schema in
 -drop                   drop benchmarks schema
 -dt <driverType>        driver type (oci|thin)
 -g                      run in graphical mode (default)
 -generate               generate data for benchmark if available
 -h,--help               print this message
 -hashpart               use hash paritioning model if it exists
 -hcccompress            use HCC compression if it exisits
 -nocompress             don't use any database compression
 -noindexes              don't build any indexes for schema
 -nopart                 don't use any database partitioning
 -normalfile             use normal file tablespaces
 -oltpcompress           use OLTP compression if it exisits
 -p <password>           password for benchmark schema
 -part                   use default paritioning model if it exists
 -pkindexes              only create primary keys for schema
 -rangepart              use a range paritioning model if it exisits
 -s                      run in silent mode
 -scale <scale>          mulitiplier for default config
 -sp <soft partitions>   the number of softparitions used. Defaults to cpu
                         count
 -tc <thread count>      the number of threads(parallelism) used to
                         generate data. Defaults to cpus*2
 -ts <tablespace>        tablespace to create schema in
 -u <username>           username for benchmark schema
 -v                      run in verbose mode when running from command
                         line
 -version <version>      version of the benchmark to run
[oracle@db50 bin]$
實際我這里測試,用到的參數有 -cl, -create, -c, -scale, -tc, -part
其中-cl, -create是必須的;-c是指定某個xml配置文件,-scale是指純數據量(是默認1G配置的多少倍),-tc是指並行度,-part是指分區。
./oewizard -cl -create -c oewizard.xml -scale 150 -tc 64 -part
而關於oewizard.xml 這個配置文件,我只改了下面這部分的內容,其他保持不變:
<DefaultParameters>
   <Parameter Key="datatablespacesexists" Value="true"/>
   <Parameter Key="password" Value="soe"/>
   <Parameter Key="username" Value="soe"/>
   <Parameter Key="datafile" Value="+DATA"/>
   <Parameter Key="userexists" Value="true"/>
   <Parameter Key="connectionstring" Value="//db50/jyzhao"/>
   <Parameter Key="connectiontype" Value="thin"/>
   <Parameter Key="onlydropuser" Value="false"/>
   <Parameter Key="operation" Value="create"/>
   <Parameter Key="tablespace" Value="SOE"/>
   <Parameter Key="dbausername" Value="sys as sysdba"/>
   <Parameter Key="dbapassword" Value="oracle"/>
   <Parameter Key="output" Value="Verbose"/>
</DefaultParameters>
主要就是確認壓測用戶及密碼,以及數據文件的創建位置、數據庫連接字符串、數據庫sys用戶及密碼這些項。
而技巧就是,如果不確認自己的配置文件寫的正確與否,可以先這樣執行,帶入對應的參數,調用圖形走一遍check下所有配置:
./oewizard -c oewizard.xml -scale 150 -tc 64 -part
確認無誤后,我這里由於生成的數據量很大,裸數據就150G,這還不算索引。所以采用后台執行的方式,並在執行前后記錄一個時間:
--1.生成壓測數據腳本
$ cat test150.sh
date
echo "=====Begin====="
./oewizard -cl -create -c oewizard.xml -scale 150 -tc 64 -part
echo "=====End====="
date

--2.后台執行,輸出日志
nohup sh test150.sh > test150.log &

--3.跟蹤日志輸出
tail -20f test150.log
最終花了將近4小時才生成完畢:
[oracle@yzdb1 bin]$ tail -20f test150.log
Fri Aug 31 10:52:54 CST 2018
=====Begin=====
SwingBench Wizard
Author  :        Dominic Giles
Version :        2.5.0.971

Running in Lights Out Mode using config file : oewizard.xml

============================================
|           Datagenerator Run Stats        |
============================================
Connection Time                        0:00:00.005
Data Generation Time                   3:41:44.395
DDL Creation Time                      0:09:00.405
Total Run Time                         3:50:44.809
Rows Inserted per sec                      136,446
Data Generated (MB) per sec                   10.9
Actual Rows Generated                1,816,220,694


Post Creation Validation Report
===============================
The schema appears to have been created successfully.

Valid Objects
=============
Valid Tables : 'ORDERS','ORDER_ITEMS','CUSTOMERS','WAREHOUSES','ORDERENTRY_METADATA','INVENTORIES','PRODUCT_INFORMATION','PRODUCT_DESCRIPTIONS','ADDRESSES','CARD_DETAILS'
Valid Indexes : 'PRD_DESC_PK','PROD_NAME_IX','PRODUCT_INFORMATION_PK','PROD_SUPPLIER_IX','PROD_CATEGORY_IX','INVENTORY_PK','INV_PRODUCT_IX','INV_WAREHOUSE_IX','ORDER_PK','ORD_SALES_REP_IX','ORD_CUSTOMER_IX','ORD_ORDER_DATE_IX','ORD_WAREHOUSE_IX','ORDER_ITEMS_PK','ITEM_ORDER_IX','ITEM_PRODUCT_IX','WAREHOUSES_PK','WHS_LOCATION_IX','CUSTOMERS_PK','CUST_EMAIL_IX','CUST_ACCOUNT_MANAGER_IX','CUST_FUNC_LOWER_NAME_IX','ADDRESS_PK','ADDRESS_CUST_IX','CARD_DETAILS_PK','CARDDETAILS_CUST_IX'
Valid Views : 'PRODUCTS','PRODUCT_PRICES'
Valid Sequences : 'CUSTOMER_SEQ','ORDERS_SEQ','ADDRESS_SEQ','LOGON_SEQ','CARD_DETAILS_SEQ'
Valid Code : 'ORDERENTRY'
Schema Created
=====End=====
Fri Aug 31 14:43:42 CST 2018
事實證明我在執行開始和結束的地方加的這個時間,有些多此一舉了哈,人家軟件有統計Total Run Time。
2.進行壓力測試
使用圖形模式,就是直接執行 ./swingbench 然后配置完成后進行壓力測試直接可以直觀顯示類似下面這樣的壓測結果: 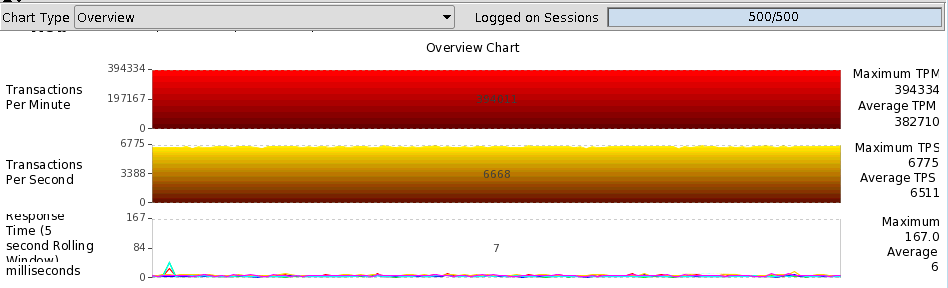 使用字符的話,就需要調用 ./charbench ,有效的參數如下:[oracle@db50 bin]$ ./charbench -h
usage: parameters:
-D <variable=value> use value for given environment variable
-a run automatically
-be <stopafter> end recording statistics after. Value is in
the form hh:mm
-bg indicate that charbench will be run in the
background
-bs <startafter> start recording statistics after. Value is
in the form hh:mm
-c <filename> specify config file
-co <hostname> specify/override coordinator in
configuration file.
-com <comment> specify comment for this benchmark run (in
double quotes)
-cpuloc <hostname > specify/overide location/hostname of the
cpu monitor.
-cpupass specify/overide os password of the user
used to monitor cpu.
-cpuuser specify/overide os username of the user
used to monitor cpu.
-cs <connectstring> override connect string in configuration
file
-debug turn on debugging. Written to standard out
-debugf turn on debugging. Witten to debug.log.
-debugfine turn on finest level of debugging
-di <shortname(s)> disable transactions(s) by short name,
comma separated
-dt <drivertype> override driver type in configuration file
(thin, oci, ttdirect, ttclient)
-dumptx output transaction response times to file
-dumptxdir <directory name> directory for transaction response times
files
-en <shortname(s)> enable transactions(s) by short name, comma
separated
-env display environment configuration
-f force data collection and run termination
regardless of state
-g <groupID> distributed group identifier
-h,--help print this message
-i run interactively (default)
-intermax <milliseconds> override minimum inter transaction sleep
time (default = 0)
-intermin <milliseconds> override minimum inter transaction sleep
time (default = 0)
-ld <milliseconds> specify/overide the logon delay
(milliseconds)
-max <milliseconds> override maximum intra transaction think
time in configuration file
-min <milliseconds> override minimum intra transaction think
time in configuration file
-p <password> override password in configuration file
-r <filename> specify results file
-rr specify/overide refresh rate for charts in
secs
-rt <runtime> specify/overide run time for the benchmark.
Value is in the form hh:mm
-s run silent
-stats <stats level> specify level result stats detail (full or
simple)
-u <username> override username in configuration file
-uc <user count> override user count in configuration file.
-v <options> display run statistics (vmstat/sar like
output), options include (comma separated no spaces).
trans|cpu|disk|dml|errs|tpm|tps|users|resp|vresp
-vo <verboseOutput> output file for verbose output (defaults to
stdout)
[oracle@db50 bin]$
而最重要的xml配置文件如果手動編輯就更是很苦惱的一件事,同樣利用技巧,圖形調用后配置好各參數然后另存為導出一份xml配置即可。
比如導出的xml配置文件是模擬的2000並發的OLTP類型業務,文件名取為oltp2000.xml
那么字符測試就可以直接調用:
--簡單的只看事物量
[oracle@db50 bin]$ ./charbench -c oltp2000.xml

--指定其中一台機器登陸信息,同時看到這台機器的CPU和I/O負載情況,以及響應時間
[oracle@db50 bin]$ ./charbench -c oltp2000.xml -cpuloc db50 -cpuuser oracle -cpupass oracle -v 'users,cpu,disk,tpm,tps,resp' > oltp2000_load50.log
[oracle@db50 bin]$ ./charbench -c oltp2000.xml -cpuloc db52 -cpuuser oracle -cpupass oracle -v 'users,cpu,disk,tpm,tps,resp' > oltp2000_load52.log

--准生產的數據當時沒有留存,這里就用我實驗環境的數據(50並發)簡單說明下:
[oracle@db50 bin]$ tail -20f oltp2000_load50.log
Author  :        Dominic Giles
Version :        2.5.0.971

Results will be written to results.xml.
Hit Return to Terminate Run...

Time            Users   User    System  Wait    Idle    Bi      Bo      TPM     TPS     Response
23:19:30        [0/50]  0       0       0       0       0       0       0       0       0
23:19:33        [0/50]  0       0       0       0       0       0       0       0       0
23:19:34        [0/50]  11      22      2       65      19      2194    0       0       0
23:19:35        [0/50]  27      44      0       28      155     1514    0       0       0
23:19:36        [0/50]  8       24      1       67      31      1593    0       0       0
23:19:37        [12/50] 5       27      2       65      56      2626    0       0       0
23:19:38        [35/50] 6       11      1       82      39      1152    0       0       0
23:19:39        [50/50] 8       20      2       71      23      2802    0       0       0
23:19:40        [50/50] 16      33      0       51      820     1218    43      43      233
23:19:41        [50/50] 26      73      1       0       1780    580     161     118     390
23:19:42        [50/50] 45      54      1       0       1833    658     264     103     393
23:19:43        [50/50] 36      63      1       0       1959    655     384     120     361
23:19:44        [50/50] 25      75      0       0       1999    703     487     103     366
23:19:45        [50/50] 33      66      1       0       1611    588     563     76      380
23:19:46        [50/50] 46      53      1       0       1727    724     650     87      384
23:19:47        [50/50] 35      64      1       0       1607    694     766     116     376
23:19:48        [50/50] 30      69      1       0       1587    596     852     86      382
23:19:49        [50/50] 31      68      1       0       2227    629     945     93      380
23:19:50        [50/50] 46      54      0       0       2611    689     1034    89      385
23:19:51        [50/50] 35      64      1       0       1763    626     1127    93      385
23:19:52        [50/50] 22      76      2       0       2276    825     1248    121     379
23:19:53        [50/50] 29      70      1       0       2195    787     1378    130     371
23:19:54        [50/50] 43      55      2       0       2075    767     1490    112     365
23:19:55        [50/50] 39      61      0       0       1827    965     1617    127     359
23:19:56        [50/50] 29      71      0       0       1951    646     1715    98      360
23:19:57        [50/50] 37      63      0       0       1611    946     1799    84      365
23:19:58        [50/50] 45      55      0       0       1671    834     1912    113     366
23:19:59        [50/50] 34      66      0       0       1867    705     2023    111     362
23:20:00        [50/50] 39      61      0       0       2235    889     2137    114     358
23:20:01        [50/50] 40      60      0       0       1931    859     2245    108     357
23:20:02        [50/50] 36      64      0       0       1866    892     2362    117     355
23:20:03        [50/50] 38      62      0       0       2758    734     2450    88      353
23:20:04        [50/50] 42      58      0       0       3191    913     2539    89      351
23:20:05        [50/50] 47      53      0       0       2451    935     2636    97      352
23:20:06        [50/50] 48      52      0       0       2059    652     2725    89      350
23:20:07        [50/50] 42      58      0       0       2575    995     2802    77      348
23:20:08        [50/50] 42      58      0       0       2295    658     2868    66      355
可以看到,我這里測試的50個用戶[50/50]很快連接上,之后CPU的信息有4列(User, System, Wait, Idle),I/O的信息(Bi, Bo)有兩列,最后三列(TPM, TPS, Response)就分別是每分鍾事物量、每秒種事物量、響應時間。
當然了我這里的這個測試環境由於配置很低,且沒有做專門的調優,測出的性能數據不是很好看了,只是演示用~