微信小程序圖表插件(wx-charts)基於canvas繪制,體積小巧支持圖表類型餅圖、線圖、柱狀圖 、區域圖等圖表圖形繪制,目前wx-charts是微信小程序圖表插件中比較強大好使的一個。
wx-charts基於canvas繪制的微信小程序圖表插件
支持圖表類型
- 餅圖 pie
- 線圖 line
- 柱狀圖 column
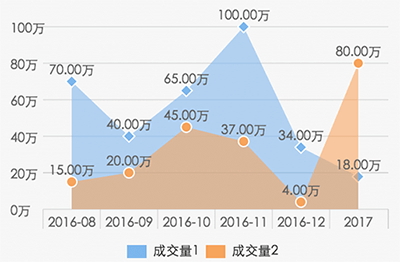
- 區域圖 area
高清顯示
設置canvas的尺寸為2倍大小,然后縮小到50%,建議都進行這樣的設置,圖表本身繪制時是按照高清顯示配置的,不然整體效果會偏大
/* 例如設計圖尺寸為320 x 300 */
.canvas {
    width: 640px;
    height: 600px;
    transform: scale(0.5)
}
wx-charts參數說明
opts Object
opts.canvasId String required 微信小程序canvas-id
opts.width Number required canvas寬度,單位為px
opts.height Number required canvas高度,單位為px
opts.type String required 圖表類型,可選值為pie, line, column, area
opts.categories Array required (餅圖不需要) 數據類別分類
opts.dataLabel Boolean default true 是否在圖表中顯示數據內容值
opts.yAxis Object Y軸配置
opts.yAxis.format Function 自定義Y軸文案顯示
opts.yAxis.min Number Y軸起始值
opts.yAxis.title String Y軸title
opts.series Array required 數據列表
數據列表每項結構定義
dataItem Object
dataItem.data Array required (餅圖為Number) 數據
dataItem.color String 例如#7cb5ec 不傳入則使用系統默認配色方案
dataItem.name String 數據名稱
dateItem.format Function 自定義顯示數據內容
wx-charts圖表插件示例
餅圖pie chart
var Charts = require('charts.js');
new Charts({
    canvasId: 'pieCanvas',
    type: 'pie',
    series: [{
        name: '成交量1',
        data: 15,
    }, {
        name: '成交量2',
        data: 35,
    }, {
        name: '成交量3',
        data: 78,
    }, {
        name: '成交量4',
        data: 63,
    }],
    width: 640,
    height: 400,
    dataLabel: false
});

線圖line chart
new Charts({
    canvasId: 'lineCanvas',
    type: 'line',
    categories: ['2012', '2013', '2014', '2015', '2016', '2017'],
    series: [{
        name: '成交量1',
        data: [0.15, 0.2, 0.45, 0.37, 0.4, 0.8],
        format: function (val) {
            return val.toFixed(2) + '萬';
        }
    }, {
        name: '成交量2',
        data: [0.30, 0.37, 0.65, 0.78, 0.69, 0.94],
        format: function (val) {
            return val.toFixed(2) + '萬';
        }
    }],
    yAxis: {
        title: '成交金額 (萬元)',
        format: function (val) {
            return val.toFixed(2);
        },
        min: 0
    },
    width: 640,
    height: 400
});

柱狀圖columnChart
new Charts({
    canvasId: 'columnCanvas',
    type: 'column',
    categories: ['2016-08', '2016-09', '2016-10', '2016-11', '2016-12', '2017'],
    series: [{
        name: '成交量1',
        data: [15, 20, 45, 37, 4, 80]
    }, {
        name: '成交量2',
        data: [70, 40, 65, 100, 34, 18]
    }, {
        name: '成交量3',
        data: [70, 40, 65, 100, 34, 18]
    }, {
        name: '成交量4',
        data: [70, 40, 65, 100, 34, 18]
    }],
    yAxis: {
        format: function (val) {
            return val + '萬';
        }
    },
    width: 640,
    height: 400,
    dataLabel: false
});
項目地址及下載:
https://github.com/xiaolin3303/wx-charts
本文鏈接:微信小程序圖表插件(wx-charts)http://www.51xuediannao.com/xiaochengxu/wx-charts.html