Matplotlib
matplotlib 是python最著名的繪圖庫,它提供了一整套和matlab相似的命令API,十分適合交互式地行制圖。而且也可以方便地將它作為繪圖控件,嵌入GUI應用程序中。
優勢
作為python上最有名氣的繪圖庫:
- Matlab的語法
python語言
latex的畫圖質量
可以使用內嵌的latex引擎繪制的數學公式
快速繪圖
matplotlib實際上是一套面向對象的繪圖庫,它所繪制的圖表中的每個繪圖元素,例如線條Line2D、文字Text、刻度等在內存中都有一個對象與之對應。
*為了方便快速繪圖matplotlib通過pyplot模塊提供了一套和MATLAB類似的繪圖API,將眾多繪圖對象所構成的復雜結構隱藏在這套API內部。我們只需要調用pyplot模塊所提供的函數就可以實現快速繪圖以及設置圖表的各種細節。*pyplot模塊雖然用法簡單,但不適合在較大的應用程序中使用。
為了將面向對象的繪圖庫包裝成只使用函數的調用接口,pyplot模塊的內部保存了當前圖表以及當前子圖等信息。當前的圖表和子圖可以使用plt.gcf()和plt.gca()獲得,分別表示“Get Current Figure”和“Get Current Axes”。在pyplot模塊中,許多函數都是對當前的Figure或Axes對象進行處理
plt.plot()實際上會通過plt.gca()獲得當前的Axes對象ax,然后再調用ax.plot()方法實現真正的繪圖
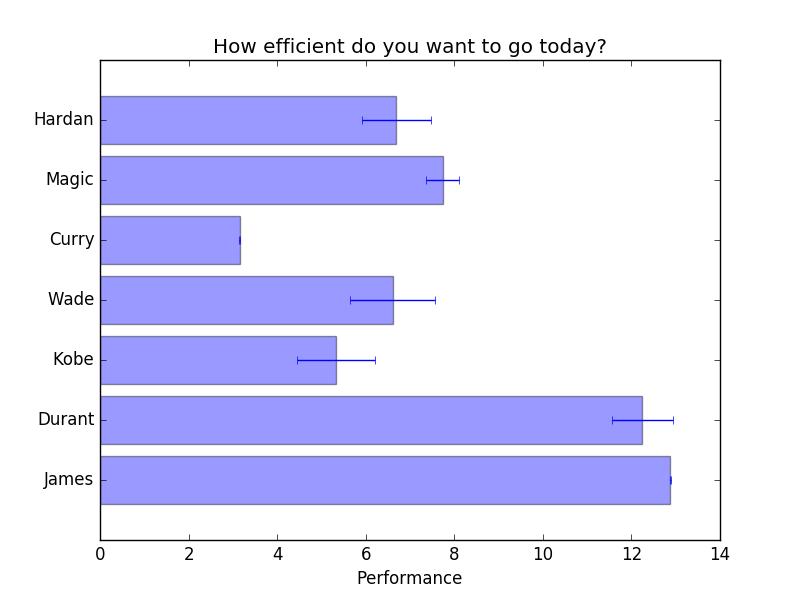
柱狀圖
橫向
import matplotlib.pyplot as plt
plt.rcdefaults()
import numpy as np

people = ('James', 'Durant', 'Kobe', 'Wade', 'Curry','Magic','Hardan')
y_pos = np.arange(len(people))
performance = 3 + 10 * np.random.rand(len(people)) #隨機產生len(people)個 [0,1)的數
error = np.random.rand(len(people))

plt.barh(y_pos, performance, xerr=error, align='center', alpha=0.4)#這里是產生橫向柱狀圖 barh h--horizontal
plt.yticks(y_pos, people)
plt.xlabel('Performance')
plt.title('How efficient do you want to go today?')
plt.savefig("barh.png",format="png")
縱向

people = ('James', 'Durant', 'Kobe', 'Wade', 'Curry','Magic','Hardan')
x_pos = np.arange(len(people))
performance = 5 + 10 * np.random.rand(len(people)) #隨機產生len(people)個 [0,1)的數
error = np.random.rand(len(people))/4

plt.bar(x_pos, performance, xerr=error, align='center', alpha=0.4)
plt.xticks(x_pos, people)
plt.ylabel('Performance')
plt.title('How efficient do you want to go today?')
plt.savefig("bar.png",format="png")
解析
plt.rcdefaults()
恢復 rc 的默認設置
barh()
- 主要功能
:做一個橫向條形圖,橫向條的矩形大小為: left, left + width, bottom, bottom + height
bar()
- 主要功能
:做一個縱向條形圖,縱向條的矩形大小為: left, left + width, bottom, bottom + height
- 參數
:barh ( bottom , width , height =0.8, left =0, ** kwargs )
:bar ( bottom , width , height =0.8, left =0, ** kwargs )
- 返回類型
:一個 class 類別,matplotlib.patches.Rectangle實例
參數說明
:bottom: Bars 的垂直位置的底部邊緣width: Bars 的長度
可選參數:
height: bars 的高度
left: bars 左邊緣 x 軸坐標值
color: bars 顏色
edgecolor: bars 邊緣顏色
linewidth: bar 邊緣寬度;None 表示默認寬度;0 表示不 i 繪制邊緣
xerr: 若不為 None,將在 bar 圖上生成 errobars
yerr: 若不為 None,將在 bar 圖上生成 errobars
ecolor: 指定 errorbar 顏色
capsize: 指定 errorbar 的頂部(cap)長度
align:
edge(默認) |center:edge以底部為准對齊;center以 y 軸作為中心log: [False|True] False (默認),若為 True,使用 log 坐標
圖形填充
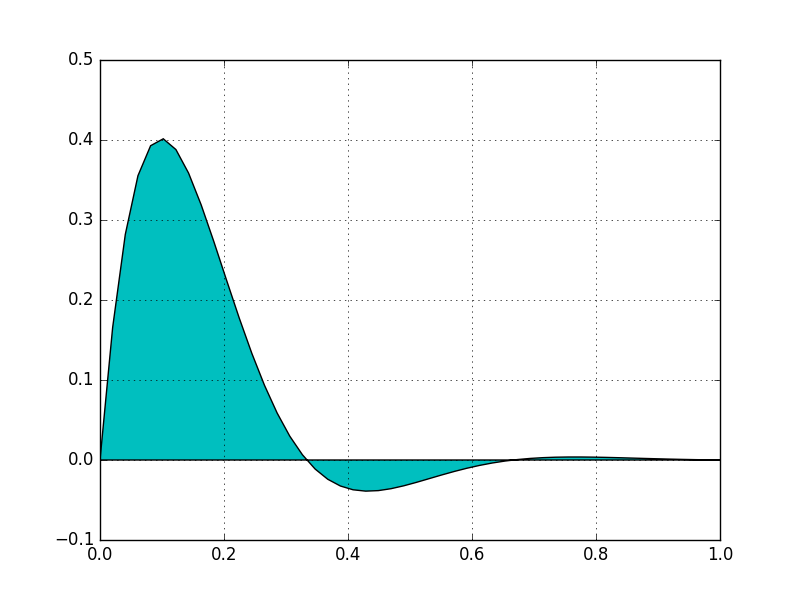
import numpy as np
import matplotlib.pyplot as plt

x = np.linspace(0, 1)
y = np.sin(3 * np.pi * x) * np.exp(-7 * x)

plt.fill(x, y, 'c')
plt.grid(True)
plt.savefig("fill.png",format="png")Tip: grid 表示是否顯示圖軸網格。函數原型 matplotlib.pyplot.grid(b=None, which=’major’, axis=’both’, **kwargs)
- 調用形式:
grid(self, b=None, which=’major’, axis=’both’, **kwargs)
- 主要參數:
b: [True|False]或者是布爾數組、或[‘on’,‘off’] 表示網格是否開啟
which: [major(默認)|minor|both] 選擇主、次網格開啟方式
axis: [both(默認)|x|y] 選擇使用網格的數軸
x = np.linspace(0, 3 * np.pi, 100)
y1 = np.sin(x)
y2 = np.sin(3 * x)
plt.fill(x, y1, 'b', x, y2, 'c', alpha=0.7)
plt.savefig("features.png",format="png")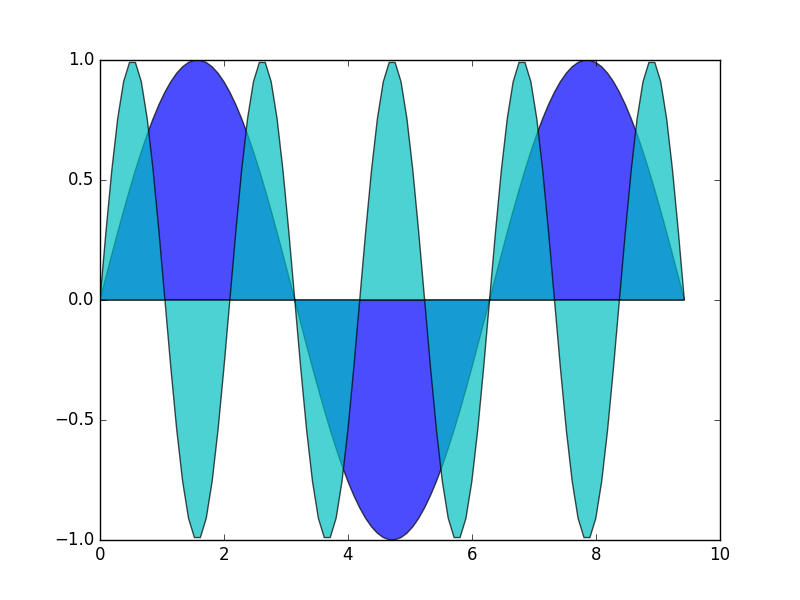
Tip:
alpha 表示透明度,0表示全透明,1表示完全不透明。