InfluxDB 是一個開源分布式時序、事件和指標數據庫。使用 Go 語言編寫,無需外部依賴。其設計目標是實現分布式和水平伸縮擴展。
特點
- schemaless(無結構),可以是任意數量的列
- Scalable
- min, max, sum, count, mean, median 一系列函數,方便統計
- Native HTTP API, 內置http支持,使用http讀寫
- Powerful Query Language 類似sql
- Built-in Explorer 自帶管理工具
管理界面:
API
InfluxDB 支持兩種api方式
- HTTP API
- Protobuf API
Protobuf 還未開發完成, 官網文檔都沒有
如何使用 http api 進行操作?
比如對於foo_production這個數據庫,插入一系列數據,可以發現POST 請求到 /db/foo_production/series?u=some_user&p=some_password, 數據放到body里。
數據看起來是這樣的:
下面的"name": "events", 其中"events"就是一個series,類似關系型數據庫的表table
[
  {
"name": "events", "columns": ["state", "email", "type"], "points": [ ["ny", "paul@influxdb.org", "follow"], ["ny", "todd@influxdb.org", "open"] ] }, { "name": "errors", "columns": ["class", "file", "user", "severity"], "points": [ ["DivideByZero", "example.py", "someguy@influxdb.org", "fatal"] ] } ] 格式是json,可以在一個POST請求發送多個 series, 每個 series 里的 points 可以是多個,但索引要和columns對應。
上面的數據里沒有包含time 列,InfluxDB會自己加上,不過也可以指定time,比如:
[
  {
    "name": "response_times", "columns": ["time", "value"], "points": [ [1382819388, 234.3], [1382819389, 120.1], [1382819380, 340.9] ] } ]
time 在InfluxDB里是很重要的,畢竟InfluxDB是time series database
在InfluxDB里還有個sequence_number字段是數據庫維護的,類似於mysql的 主鍵概念
InfluxDB 增刪更查都是用http api來完成,甚至支持使用正則表達式刪除數據,還有計划任務。
比如:
發送POST請求到 /db/:name/scheduled_deletes, body如下,
{
  "regex": "stats\..*", "olderThan": "14d", "runAt": 3 }
這個查詢會刪除大於14天的數據,並且任何以stats開頭的數據,並且每天3:00 AM運行。
更加詳細查看官方文檔: http://influxdb.org/docs/api/http.html
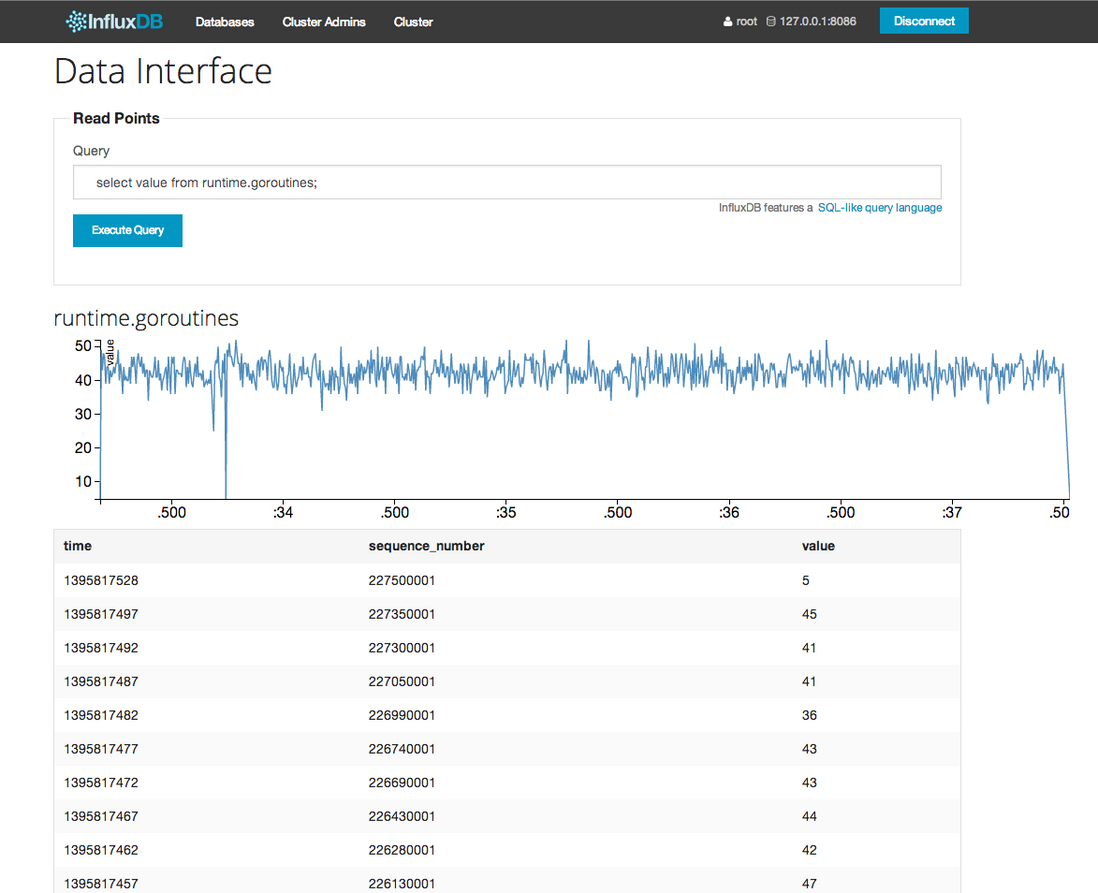
查詢語言
InfluxDB 提供了類似sql的查詢語言
看起來是這樣的:
select * from events where state == 'NY'; select * from log_lines where line =~ /error/i; select * from events where customer_id == 23 and type == 'click'; select * from response_times where value > 500; select * from events where email !~ /.*gmail.*/; select * from nagios_checks where status != 0; select * from events where (email =~ /.*gmail.* or email =~ /.*yahoo.*/) and state == 'ny'; delete from response_times where time > now() - 1h 非常容易上手, 還支持Group By, Merging Series, Joining Series, 並內置常用統計函數,比如max, min, mean 等
文檔: http://influxdb.org/docs/query_language/
庫
常用語言的庫都有,因為api簡單,也很容易自己封裝。
InfluxdDB作為很多監控軟件的后端,這樣監控數據就可以直接存儲在InfluxDBStatsD, CollectD, FluentD
還有其它的可視化工具支持InfluxDB, 這樣就可以基於InfluxDB很方便的搭建監控平台
InfluxDB 數據可視化工具
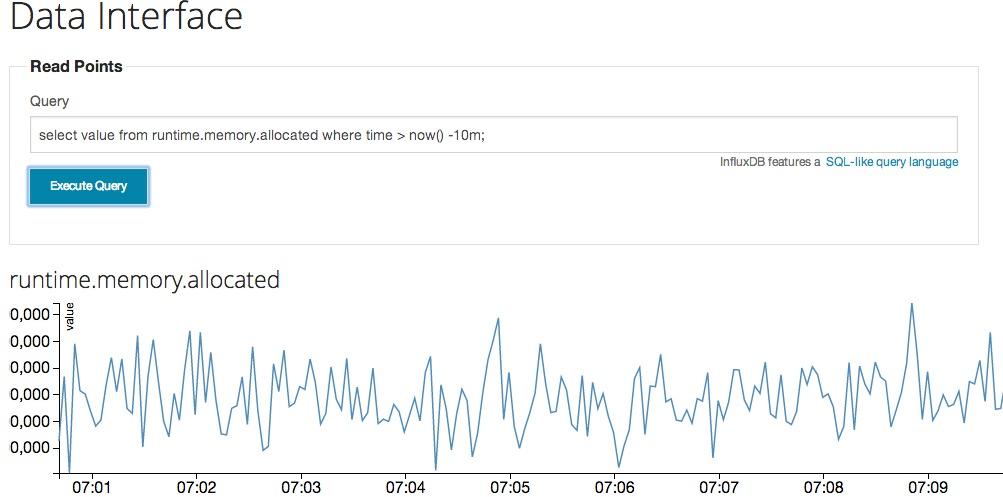
InfluxDB 用於存儲基於時間的數據,比如監控數據,因為InfluxDB本身提供了Http API,所以可以使用InfluxDB很方便的搭建了個監控數據存儲中心。
對於InfluxDB中的數據展示,官方admin有非常簡單的圖表, 看起來是這樣的
除了自己寫程序展示數據還可以選擇:
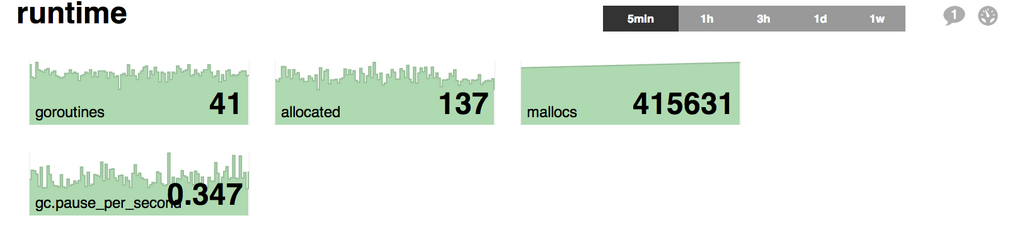
tasseo
tasseo,為Graphite寫的Live dashboard,現在也支持InfluxDB,tasseo 比較簡單, 可以配置的選項很少。
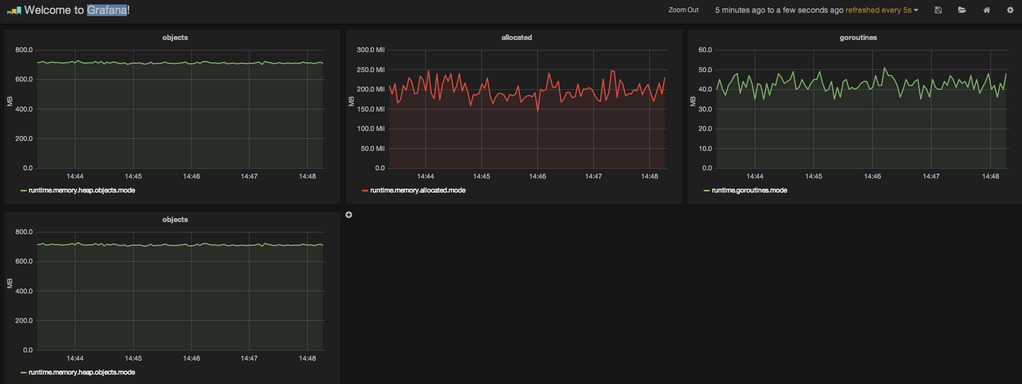
Grafana
Grafana是一個純粹的html/js應用,訪問InfluxDB時不會有跨域訪問的限制。只要配置好數據源為InfluxDB之后就可以,剩下的工作就是配置圖表。Grafana 功能非常強大。使用ElasticsSearch保存DashBoard的定義文件,也可以Export出JSON文件(Save ->Advanced->Export Schema),然后上傳回它的/app/dashboards目錄。
配置數據源:
datasources: { influx: { default: true, type: 'influxdb', url: 'http://<your_influx_db_server>:8086/db/<db_name>', username: 'test', password: 'test', } },