该文基本(全部)来自于chatjs中文文档
背景
今天在谷歌上逛博客时,突然发现shen-yu大佬根据chatjs写了一个Hexo插件,出于兴趣,打算使用并记录该插件的效果。
shen-yu大佬
chatjs中文文档
由于插件的安装和图表的使用上面两个链接已介绍得足够详细,本人只做一些图表的演示,并充当一个函数,实现代码的复用(手动狗头)。
图表
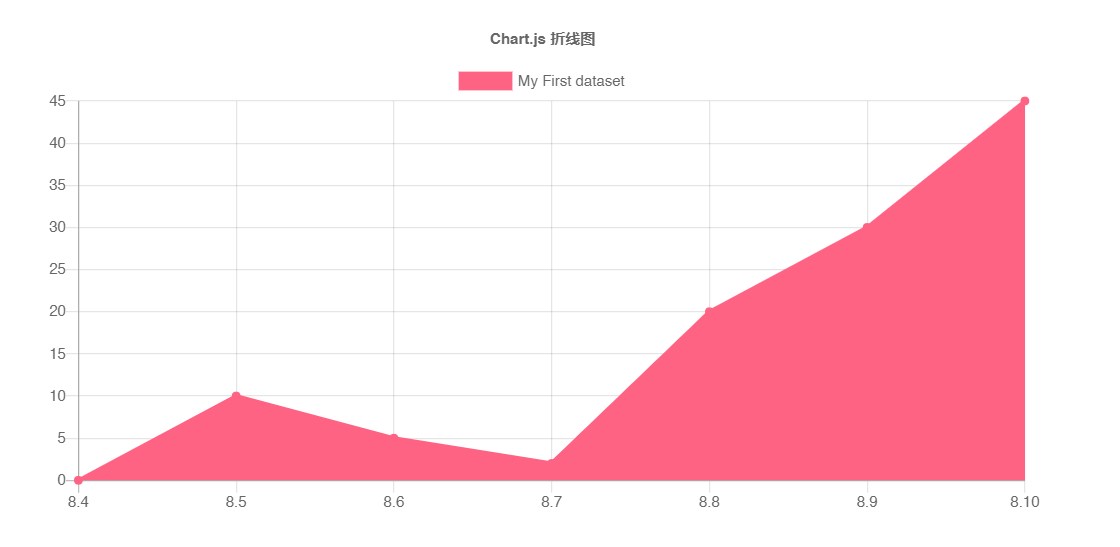
折线图
效果
示例用法
{% chart 90% 300 %}  //其中 chart 是标签名,endchart 是结束标签,不需要更改,可以通过设置 options 里面的
              aspectRatio 属性来调整图表的宽高比例,默认 width 为 100%,height 为 300px。
 {
    type: 'line',
    data: { //  折线图数据
    labels: ['8.4', '8.5', '8.6', '8.7', '8.8', '8.9', '8.10'], //  横坐标
    datasets: [{ //  纵坐标变量名称
        label: 'My First dataset',
		lineTension: 0,
        borderColor: 'rgb(255, 99, 132)', //  线条颜色
        data: [0, 10, 5, 2, 20, 30, 45] //  纵坐标
        }]
    },
    options: {
        responsive: true,
        title: {
        display: true,
        text: 'Chart.js 折线图' //  图表名称
        }
    }
}
{% endchart %}
相关属性
| 名称 | 类型 | 描述 |
|---|---|---|
backgroundColor |
Color/Color[] |
线条背景色 |
borderColor |
Color/Color[] |
线条颜色 |
borderWidth |
Number/Number[] |
线的宽度(以像素为单位) |
borderDash |
Number[] |
破折号的长度和间距。 参考 MDN |
borderDashOffset |
Number |
偏移量 参考 MDN |
borderCapStyle |
String |
线帽样式 参考 MDN |
borderJoinStyle |
String |
线连接风格 参考 MDN |
cubicInterpolationMode |
String |
离散的点之间的连接方式 |
fill |
Boolean/String |
折线区域的填充方式 |
label |
String |
在图例和工具提示中显示的数据集的标签。 |
lineTension |
Number |
贝塞尔曲线张力。设置为 0 绘制直线。如果使用单调立方插值,则忽略此选项。 |
pointBackgroundColor |
Color/Color[] |
点的填充色 |
pointBorderColor |
Color/Color[] |
点的边框色 |
pointBorderWidth |
Number/Number[] |
点边框宽度(以像素为单位) |
pointRadius |
Number/Number[] |
点的半径。如果设置为 0,则不显示。 |
pointStyle |
String/String[]/Image/Image[] |
数据点的样式 |
pointHitRadius |
Number/Number[] |
对鼠标事件作出响应的非显示点的像素大小。 |
pointHoverBackgroundColor |
Color/Color[] |
鼠标悬浮时点背景颜色。 |
pointHoverBorderColor |
Color/Color[] |
鼠标悬浮时点的边框色 |
pointHoverBorderWidth |
Number/Number[] |
鼠标悬浮时点的边框宽度 |
pointHoverRadius |
Number/Number[] |
鼠标悬浮时点的半径大小 |
showLine |
Boolean |
如果设置 false,则不会为此数据集绘制线条。 |
spanGaps |
Boolean |
如果为 true,则会在没有或为空数据的点之间绘制线条。如果为 false,则带有 NaN 数据的点会产生一个中断 |
steppedLine |
Boolean/String |
是否显示为阶梯线 |
xAxisID |
String |
绘制此数据集的 x 轴的 ID。如果未指定,则默认为第一个找到的 x 轴的 ID。 |
yAxisID |
String |
绘制该数据集的 y 轴的 ID。如果未指定,则默认为第一个找到的 y 轴的 ID。 |
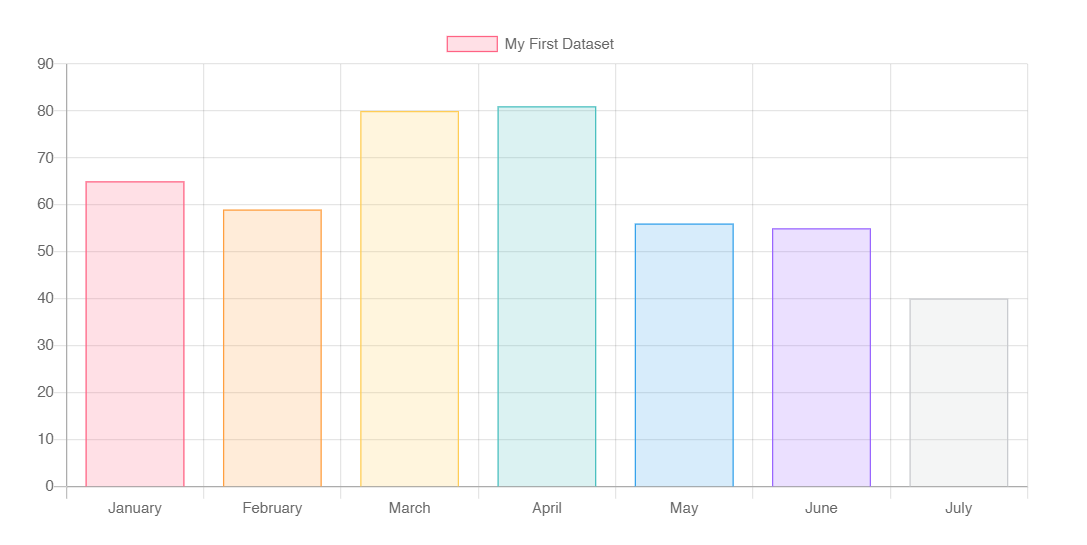
柱状图
效果·垂直柱状图
示例用法·垂直柱状图
{% chart 90% 300 %}
{
    "type":"bar",
    "data":{
        "labels":["January","February","March","April","May","June","July"],
        "datasets":[{
        "label":"My First Dataset",
        "data":[65,59,80,81,56,55,40],
        "fill":false,
        "backgroundColor":["rgba(255, 99, 132, 0.2)","rgba(255, 159, 64, 0.2)","rgba(255, 205, 86, 0.2)","rgba(75, 192, 192, 0.2)","rgba(54, 162, 235, 0.2)","rgba(153, 102, 255, 0.2)","rgba(201, 203, 207, 0.2)"],
        "borderColor":["rgb(255, 99, 132)","rgb(255, 159, 64)","rgb(255, 205, 86)","rgb(75, 192, 192)","rgb(54, 162, 235)","rgb(153, 102, 255)","rgb(201, 203, 207)"],
        "borderWidth":1
                     }]
            },
    "options":{
        "scales":{
            "yAxes":[{
                "ticks":{
                    "beginAtZero":true
                        }
                    }]
               }
            }
}
{% endchart %}
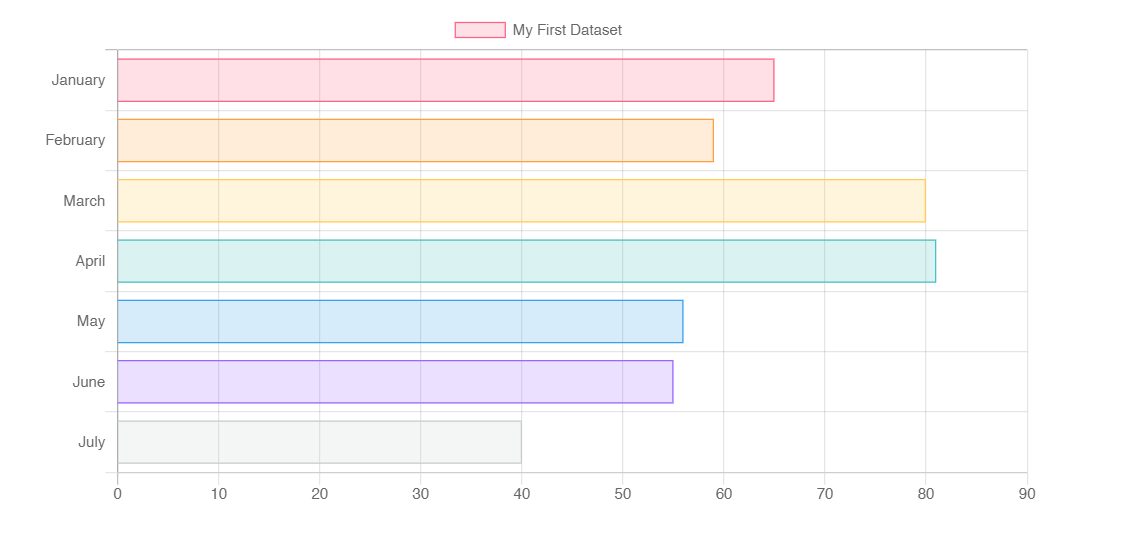
效果·水平柱状图
示例用法·水平柱状图
{% chart 90% 300 %}
{
    "type":"horizontalBar", //  水平柱状图
    "data":{
        "labels":["January","February","March","April","May","June","July"],
        "datasets":[{
            "label":"My First Dataset",
            "data":[65,59,80,81,56,55,40],
            "fill":false,
            "backgroundColor":["rgba(255, 99, 132, 0.2)","rgba(255, 159, 64, 0.2)","rgba(255, 205, 86, 0.2)","rgba(75, 192, 192, 0.2)","rgba(54, 162, 235, 0.2)","rgba(153, 102, 255, 0.2)","rgba(201, 203, 207, 0.2)"],
            "borderColor":["rgb(255, 99, 132)","rgb(255, 159, 64)","rgb(255, 205, 86)","rgb(75, 192, 192)","rgb(54, 162, 235)","rgb(153, 102, 255)","rgb(201, 203, 207)"],
            "borderWidth":1
        }]
    },
            "options":{
                "scales":{
                    "xAxes":[{
                        "ticks":{
                            "beginAtZero":true
                        }
                    }]
                }
            }
}
{% endchart %}
相关属性
| 名称 | 类型 | 描述 |
|---|---|---|
label |
String |
在图例和工具提示中显示的数据集标签 |
xAxisID |
String |
绘制此数据集的 x 轴的 ID。如果未指定,则默认为第一个找到的 x 轴的 ID 。 |
yAxisID |
String |
绘制该数据集的 y 轴的 ID。如果未指定,则默认为第一个找到的 y 轴的 ID。 |
backgroundColor |
Color/Color[] |
柱状/条形图填充色。 |
borderColor |
Color/Color[] |
边框色 |
borderWidth |
Number/Number[] |
边框宽度(以像素为单位) |
borderSkipped |
String |
不绘制边框 |
hoverBackgroundColor |
Color/Color[] |
悬浮时的填充色 |
hoverBorderColor |
Color/Color[] |
悬浮时的边框色 |
hoverBorderWidth |
Number/Number[] |
悬浮时边框宽度 |
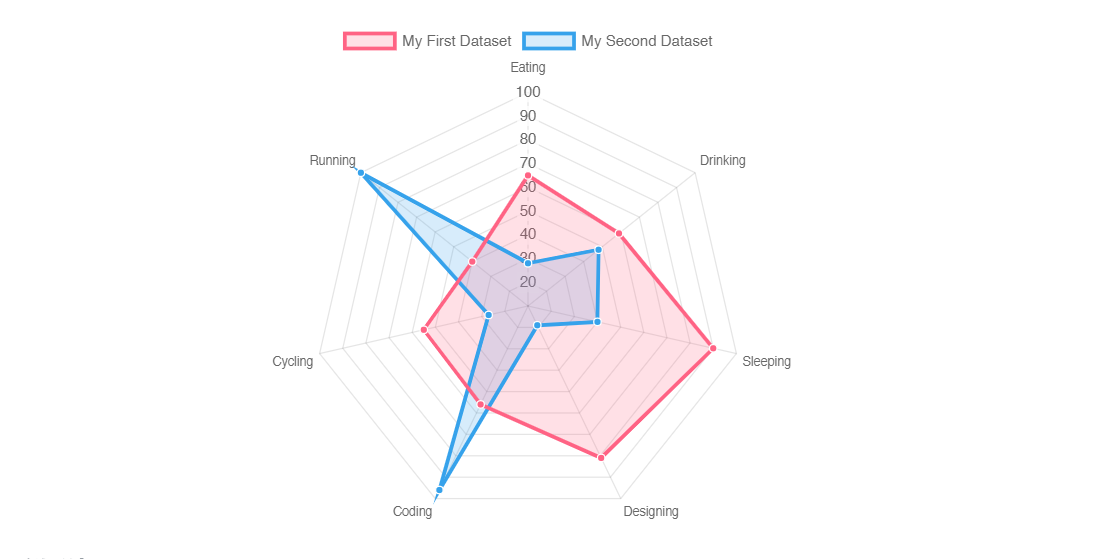
雷达图
效果
示例用法
{% chart 90% 300 %}
{
    "type":"radar",
    "data":{
        "labels":["Eating","Drinking","Sleeping","Designing","Coding","Cycling","Running"],
        "datasets":[
            {
            "label":"My First Dataset",
            "data":[65,59,90,81,56,55,40],
            "fill":true,
            "backgroundColor":"rgba(255, 99, 132, 0.2)",
            "borderColor":"rgb(255, 99, 132)",
            "pointBackgroundColor":"rgb(255, 99, 132)",
            "pointBorderColor":"#fff",
            "pointHoverBackgroundColor":"#fff",
            "pointHoverBorderColor":"rgb(255, 99, 132)"
        },
            {
                "label":"My Second Dataset",
                "data":[28,48,40,19,96,27,100],
                "fill":true,
                "backgroundColor":"rgba(54, 162, 235, 0.2)",
                "borderColor":"rgb(54, 162, 235)",
                "pointBackgroundColor":"rgb(54, 162, 235)",
                "pointBorderColor":"#fff",
                "pointHoverBackgroundColor":"#fff",
                "pointHoverBorderColor":"rgb(54, 162, 235)"
            }
        ]
    },
                "options":{
                    "elements":{
                        "line":{
                            "tension":0,
                            "borderWidth":3
                        }
                    }
                }
}
{% endchart %}
相关属性
| 名称 | 类型 | 描述 |
|---|---|---|
label |
String |
图例和工具提示中的数据集的标签名 |
backgroundColor |
Color/Color[] |
填充色 |
borderColor |
Color/Color[] |
线的颜色 |
borderWidth |
Number/Number[] |
线宽度(以像素为单位) |
borderDash |
Number[] |
破折号的长度和间距 参考 MDN |
borderDashOffset |
Number |
偏移量 参考 MDN |
borderCapStyle |
String |
线冒样式 参考 MDN |
borderJoinStyle |
String |
Line joint 样式 参考 MDN |
fill |
Boolean/String |
区域填充色 |
lineTension |
Number |
贝塞尔曲线张力。0 为直线。 |
pointBackgroundColor |
Color/Color[] |
数据点填充色 |
pointBorderColor |
Color/Color[] |
数据点边框色 |
pointBorderWidth |
Number/Number[] |
数据点边框宽度(以像素为单位) |
pointRadius |
Number/Number[] |
数据点半径。0 为不显示点 |
pointStyle |
String/String[]/Image/Image[] |
数据点样式 |
pointHitRadius |
Number/Number[] |
对鼠标事件作出响应的非显示点的像素大小。 |
pointHoverBackgroundColor |
Color/Color[] |
鼠标悬浮时,数据点背景颜色 |
pointHoverBorderColor |
Color/Color[] |
鼠标悬浮时,数据点边框色 |
pointHoverBorderWidth |
Number/Number[] |
鼠标悬浮时数据点的边框宽度 |
pointHoverRadius |
Number/Number[] |
鼠标悬停时,数据点的半径大小 |
环状/饼状图
效果·环状图
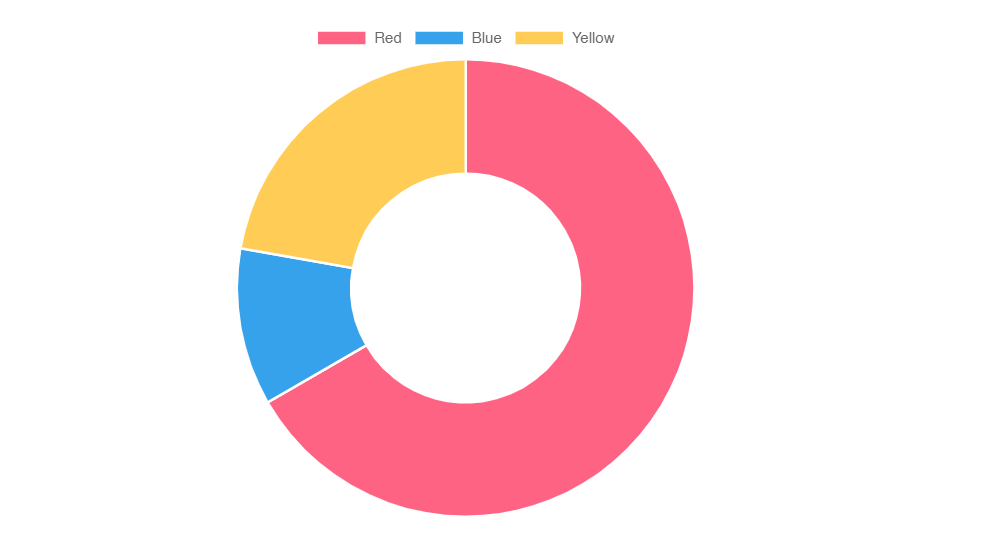
示例用法·环状图
{% chart 90% 300 %}
{
    "type":"doughnut",
    "data":{
        "labels":["Red","Blue","Yellow"],
        "datasets":[
            {
                "label":"My First Dataset",
                "data":[300,50,100],
                "backgroundColor":["rgb(255, 99, 132)","rgb(54, 162, 235)","rgb(255, 205, 86)"]
            }
        ]
    }
}
{% endchart %}
效果·饼状图
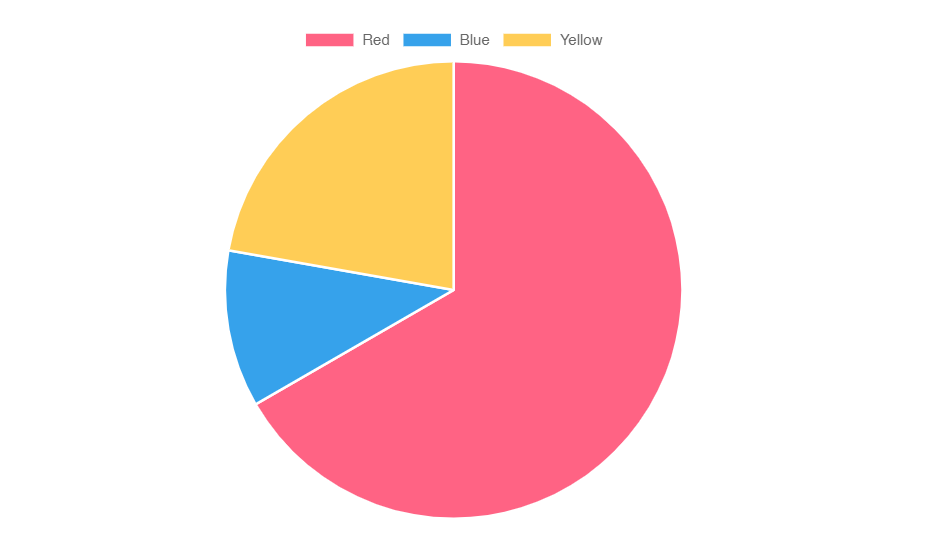
示例用法·饼状图
{% chart 90% 300 %}
{
    "type":"pie",
    "data":{
        "labels":["Red","Blue","Yellow"],
        "datasets":[
            {
                "label":"My First Dataset",
                "data":[300,50,100],
                "backgroundColor":["rgb(255, 99, 132)","rgb(54, 162, 235)","rgb(255, 205, 86)"]
            }
        ]
    }
}
{% endchart %}
相关属性
| 名称 | 类型 | 描述 |
|---|---|---|
label |
String |
图例和提示中显示的标签名 |
backgroundColor |
Color[] |
数据集中每个数据区域的填充色 |
borderColor |
Color[] |
边框色 |
borderWidth |
Number[] |
边框宽度 |
hoverBackgroundColor |
Color[] |
鼠标悬浮时的填充色 |
hoverBorderColor |
Color[] |
鼠标悬浮时边框色 |
hoverBorderWidth |
Number[] |
鼠标悬浮时边框宽度 |
| 名称 | 类型 | 默认值 | 描述 |
|---|---|---|---|
cutoutPercentage |
Number |
50 - for doughnut, 0 - for pie |
从中间切出的图表的百分比。 |
rotation |
Number |
-0.5 * Math.PI |
起始角度 |
circumference |
Number |
2 * Math.PI |
允许图形覆盖 |
animation.animateRotate |
Boolean |
true |
如果为 true,则图表将使用旋转动画进行动画。该属性在options.animation对象中。 |
animation.animateScale |
Boolean |
false |
如果为 true,则将动画从中心向外缩放图表。 |
极地图
效果
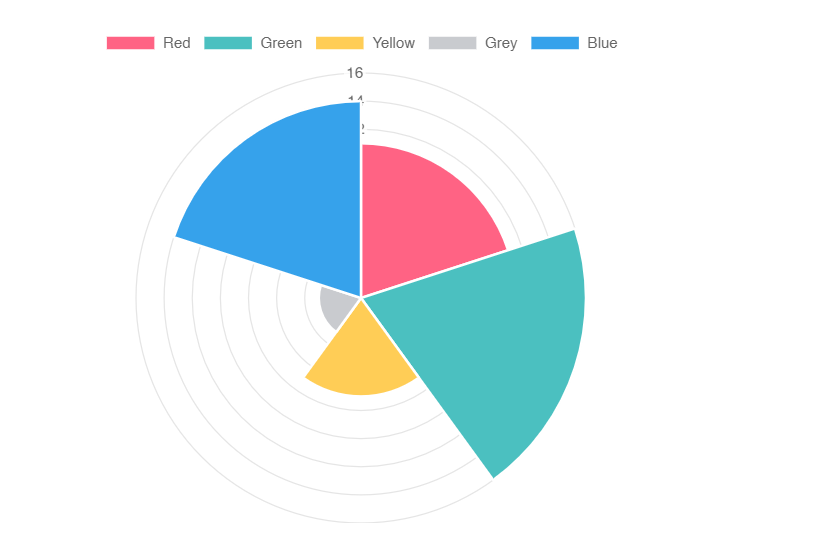
示例用法
{% chart 90% 300 %}
{
    "type":"polarArea",
    "data":{
        "labels":["Red","Green","Yellow","Grey","Blue"],
        "datasets":[
            {
                "label":"My First Dataset",
                "data":[11,16,7,3,14],
                "backgroundColor":["rgb(255, 99, 132)","rgb(75, 192, 192)","rgb(255, 205, 86)","rgb(201, 203, 207)","rgb(54, 162, 235)"]
            }
        ]
    }
}
{% endchart %}
相关属性
| 名称 | 类型 | 描述 |
|---|---|---|
label |
String |
在图例和工具提示中要显示数据集的标签 |
backgroundColor |
Color[] |
填充色 |
borderColor |
Color[] |
边框色 |
borderWidth |
Number[] |
边框宽度 |
hoverBackgroundColor |
Color[] |
鼠标悬浮时背景色 |
hoverBorderColor |
Color[] |
鼠标悬浮时边框色 |
hoverBorderWidth |
Number[] |
鼠标悬浮时边框宽度 |
气泡图
效果

示例用法
{% chart 90% 300 %}
{
    "type":"bubble",
    "data":{
        "datasets":[
            {
                "label":"First Dataset",
                "data":[
                    {"x":20,"y":30,"r":15},{"x":40,"y":10,"r":10},{"x":24,"y":20,"r":10},{"x":28,"y":16,"r":15},{"x":36,"y":12,"r":10}
                ],
                    "backgroundColor":"rgb(255, 99, 132)"
            }
        ]
    }
}
{% endchart %}
相关属性
| 名称 | 类型 | 可脚本化 | 可索引 | 默认值 |
|---|---|---|---|---|
backgroundColor |
Color |
Yes | Yes | 'rgba(0,0,0,0.1)' |
borderColor |
Color |
Yes | Yes | 'rgba(0,0,0,0.1)' |
borderWidth |
Number |
Yes | Yes | 3 |
data |
Object[] |
- | - | required |
hoverBackgroundColor |
Color |
Yes | Yes | undefined |
hoverBorderColor |
Color |
Yes | Yes | undefined |
hoverBorderWidth |
Number |
Yes | Yes | 1 |
hoverRadius |
Number |
Yes | Yes | 4 |
hitRadius |
Number |
Yes | Yes | 1 |
label |
String |
- | - | undefined |
pointStyle |
String |
Yes | Yes | circle |
radius |
Number |
Yes | Yes | 3 |
每个气泡的风格可以通过以下属性进行控制:
| 名称 | 描述 |
|---|---|
backgroundColor |
七宝背景色 |
borderColor |
气泡边框色 |
borderWidth |
气泡边框宽度 (以像素为单位) |
pointStyle |
气泡形状样式 |
radius |
气泡半径(以像素为单位) |
散点图
效果
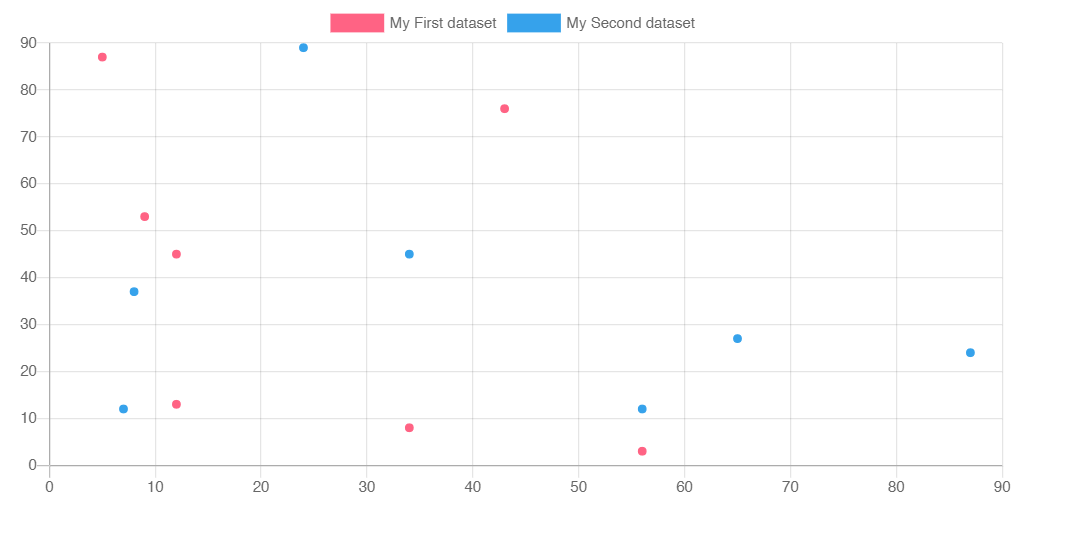
示例用法
{% chart 90% 300 %}
{
    type:'scatter',
    data:{
        labels:['January','February','March','April','May','June','July'],
        datasets:[
            {
                label:'My First dataset',
                borderColor:'rgb(255, 99, 132)',
                backgroundColor:'rgb(255, 99, 132)',
                data:[
                    {x:12,y:45,},{x:12,y:13,},{x:56,y:3,},{x:5,y:87,},{x:43,y:76,},{x:34,y:8,},{x:9,y:53,}
                ]
                },
            {
                label:'My Second dataset',
                borderColor:'rgb(54, 162, 235)',
                backgroundColor:'rgb(54, 162, 235)',
                data:[
                    {x:56,y:12,},{x:7,y:12,},{x:87,y:24,},{x:34,y:45,},{x:65,y:27,},{x:8,y:37,},{x:24,y:89,}
                ]
            }
        ],
        options:{
            title:{
                display:true,
                text:'Chart.js Scatter Chart'
            },
        }
    }
}
{% endchart %}
相关属性
| 名称 | 类型 | 描述 |
|---|---|---|
borderColor |
Color/Color[] |
点颜色 |
borderWidth |
Number/Number[] |
线的宽度(以像素为单位) |
borderDash |
Number[] |
破折号的长度和间距。 参考 MDN |
borderDashOffset |
Number |
偏移量 参考 MDN |
borderCapStyle |
String |
线帽样式 参考 MDN |
borderJoinStyle |
String |
线连接风格 参考 MDN |
cubicInterpolationMode |
String |
离散的点之间的连接方式 |
fill |
Boolean/String |
折线区域的填充方式 |
label |
String |
在图例和工具提示中显示的数据集的标签。 |
lineTension |
Number |
贝塞尔曲线张力。设置为 0 绘制直线。如果使用单调立方插值,则忽略此选项。 |
pointBackgroundColor |
Color/Color[] |
点的填充色 |
pointBorderColor |
Color/Color[] |
点的边框色 |
pointBorderWidth |
Number/Number[] |
点边框宽度(以像素为单位) |
pointRadius |
Number/Number[] |
点的半径。如果设置为 0,则不显示。 |
pointStyle |
String/String[]/Image/Image[] |
数据点的样式 |
pointHitRadius |
Number/Number[] |
对鼠标事件作出响应的非显示点的像素大小。 |
pointHoverBackgroundColor |
Color/Color[] |
鼠标悬浮时点背景颜色。 |
pointHoverBorderColor |
Color/Color[] |
鼠标悬浮时点的边框色 |
pointHoverBorderWidth |
Number/Number[] |
鼠标悬浮时点的边框宽度 |
pointHoverRadius |
Number/Number[] |
鼠标悬浮时点的半径大小 |
showLine |
Boolean |
如果设置 false,则不会为此数据集绘制线条。 |
spanGaps |
Boolean |
如果为 true,则会在没有或为空数据的点之间绘制线条。如果为 false,则带有 NaN 数据的点会产生一个中断 |
steppedLine |
Boolean/String |
是否显示为阶梯线 |
xAxisID |
String |
绘制此数据集的 x 轴的 ID。如果未指定,则默认为第一个找到的 x 轴的 ID。 |
yAxisID |
String |
绘制该数据集的 y 轴的 ID。如果未指定,则默认为第一个找到的 y 轴的 ID。 |
区域图
效果
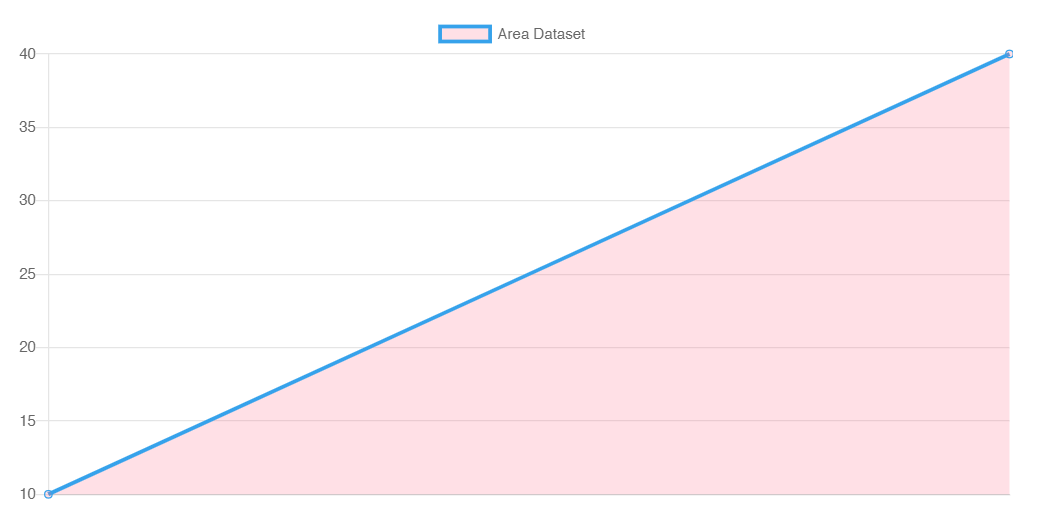
示例用法
{% chart 90% 300 %}
{
    "type":"line",
    "data":{
        "datasets":[
            {
                "label":"Area Dataset",
                "data":[10,40],
                "fill":1, //  填充--->区域图
                "borderColor":"rgb(54, 162, 235)",
                "backgroundColor":"rgba(255, 99, 132, 0.2)",
                "fill":"origin"
            },
        ]
    }
}
{% endchart %}
相关属性
| 模式 | 类型 | 值 |
|---|---|---|
| 绝对数据集索引 1 | Number |
1, 2, 3, ... |
| 相对数据集索引 1 | String |
'-1', '-2', '+1', ... |
| 边界 2 | String |
'start', 'end', 'origin' |
| 禁用 3 | Boolean |
false |
混合图
效果
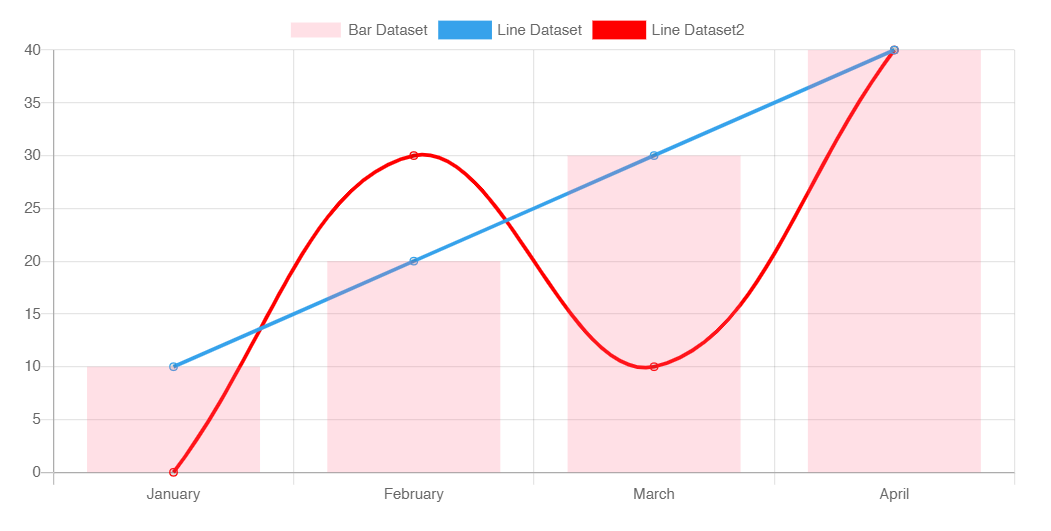
示例用法
{% chart 90% 300 %}
{
    "type":"bar",
    "data":{
        "labels":["January","February","March","April"],
        "datasets":[
            {
                "label":"Bar Dataset",
                "data":[10,20,30,40],
                "borderColor":"rgb(255, 99, 132)",
                "backgroundColor":"rgba(255, 99, 132, 0.2)"
            },
            {
                "label":"Line Dataset",
                "data":[10,20,30,40],
                "type":"line",
                "fill":false,
                "borderColor":"rgb(54, 162, 235)",
            },
            {
                "label":"Line Dataset2",
                "data":[0,30,10,40],
                "type":"line",
                "fill":false,
                "borderColor":"rgb(255, 0, 0)",
            }
        ]
    },
    "options":{
        "scales":{
            "yAxes":[
                {
                    "ticks":{
                        "beginAtZero":true
                    }
                }
            ]
        }
    }
}
{% endchart %}
相关属性
注意运用的Chart各自的属性即可。
申明
文章基本转自
shen-yu大佬
chatjs中文文档,并非原创,本人只是进行了总结和排版。