Prometheus(普羅米修斯)
新型完整的監控告警工具
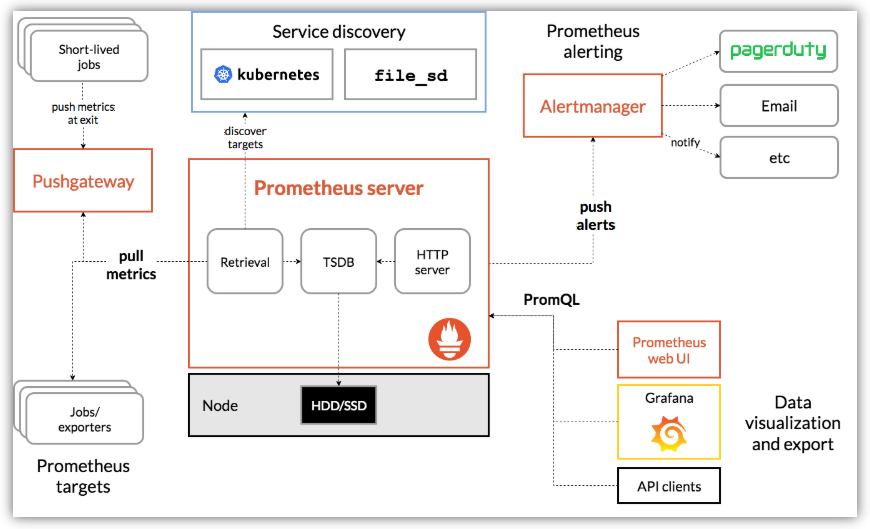
主要特點:
- 多維數據模型,時間序列數據由度量名稱和鍵/值對標識
- 一種靈活的查詢語言來利用這種維度
- 不依賴分布式存儲;單個服務器節點是自治的
- 時間序列收集通過HTTP上的拉模型進行
- 通過中間網關支持時間序列的推送
- 通過服務發現或靜態配置發現目標
- 多種模式的繪圖和儀表板的支持
機器IP: 118.190.107.96 (阿里雲)
1、安裝
# 下載地址
https://prometheus.io/download/#prometheus

# centos下載linux壓縮包即可。
# 上傳到服務器 解壓
tar xf prometheus-2.17.1.linux-amd64.tar.gz

# mv文件夾名稱
cd prometheus-2.17.1.linux-amd64
mv prometheus-2.17.1.linux-amd64 prometheus

# 更改配置ip
vim prometheus.yml

# 將 localhost 改成自己的ip地址 如下圖
    static_configs:
    - targets: ['118.190.217.164:9090']
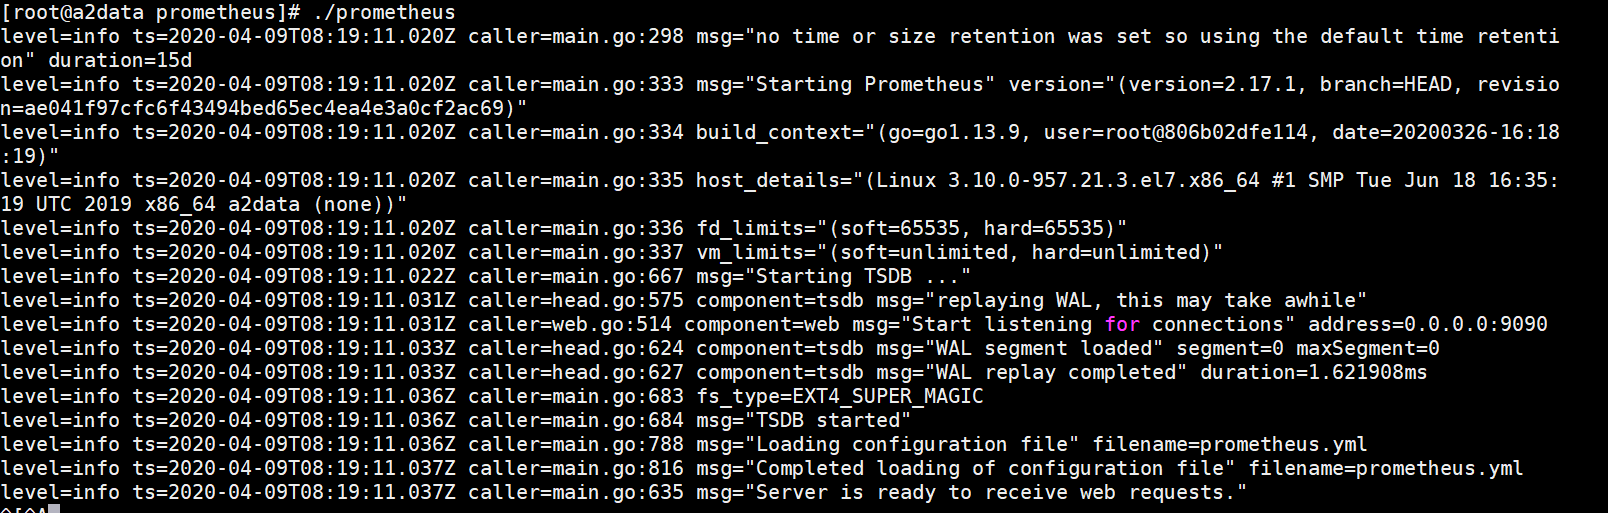
2、啟動
./prometheus
3、web ui
登錄訪問:
118.190.217.164:9090
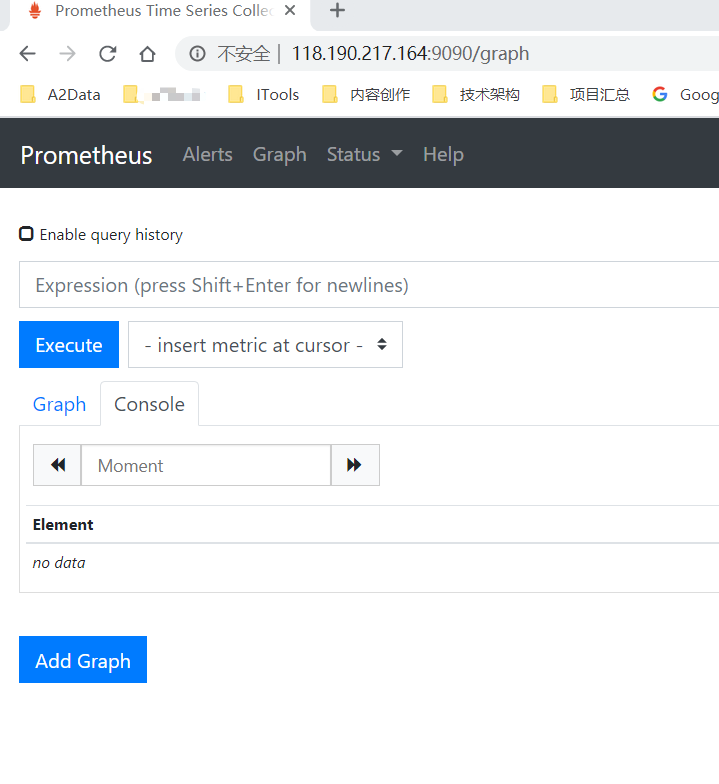
Prometheus自帶有簡單的UI
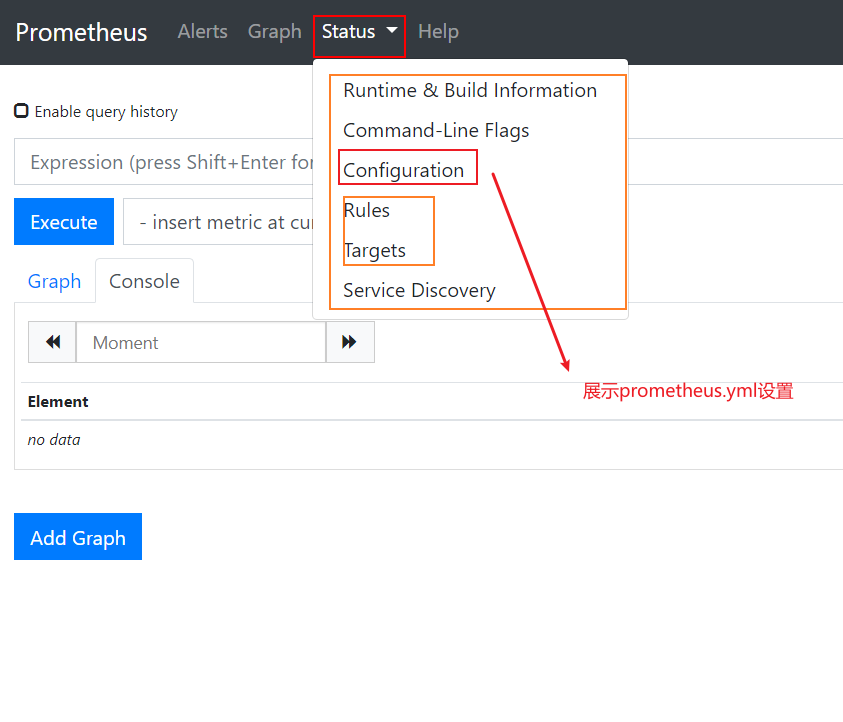
prometheus.yml的配置

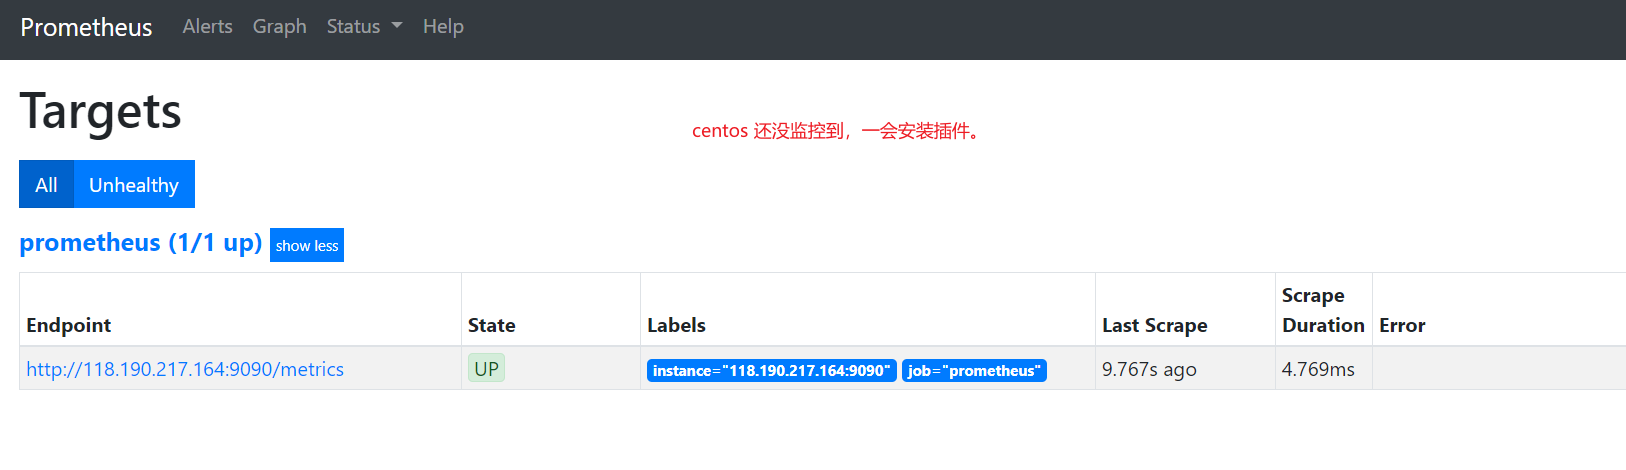
Targets展示監控具體的監控目標
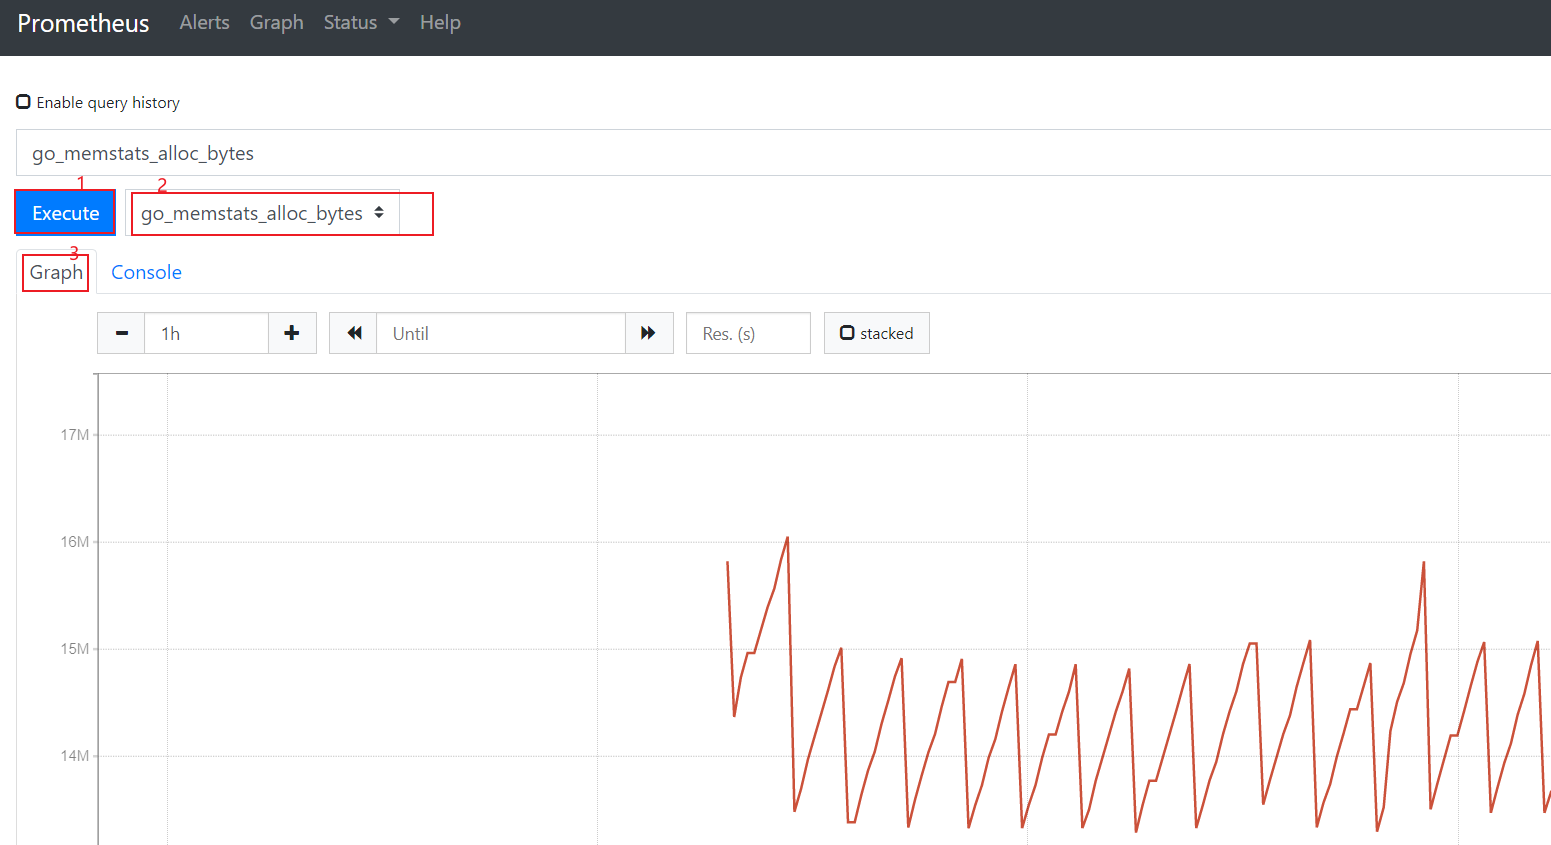
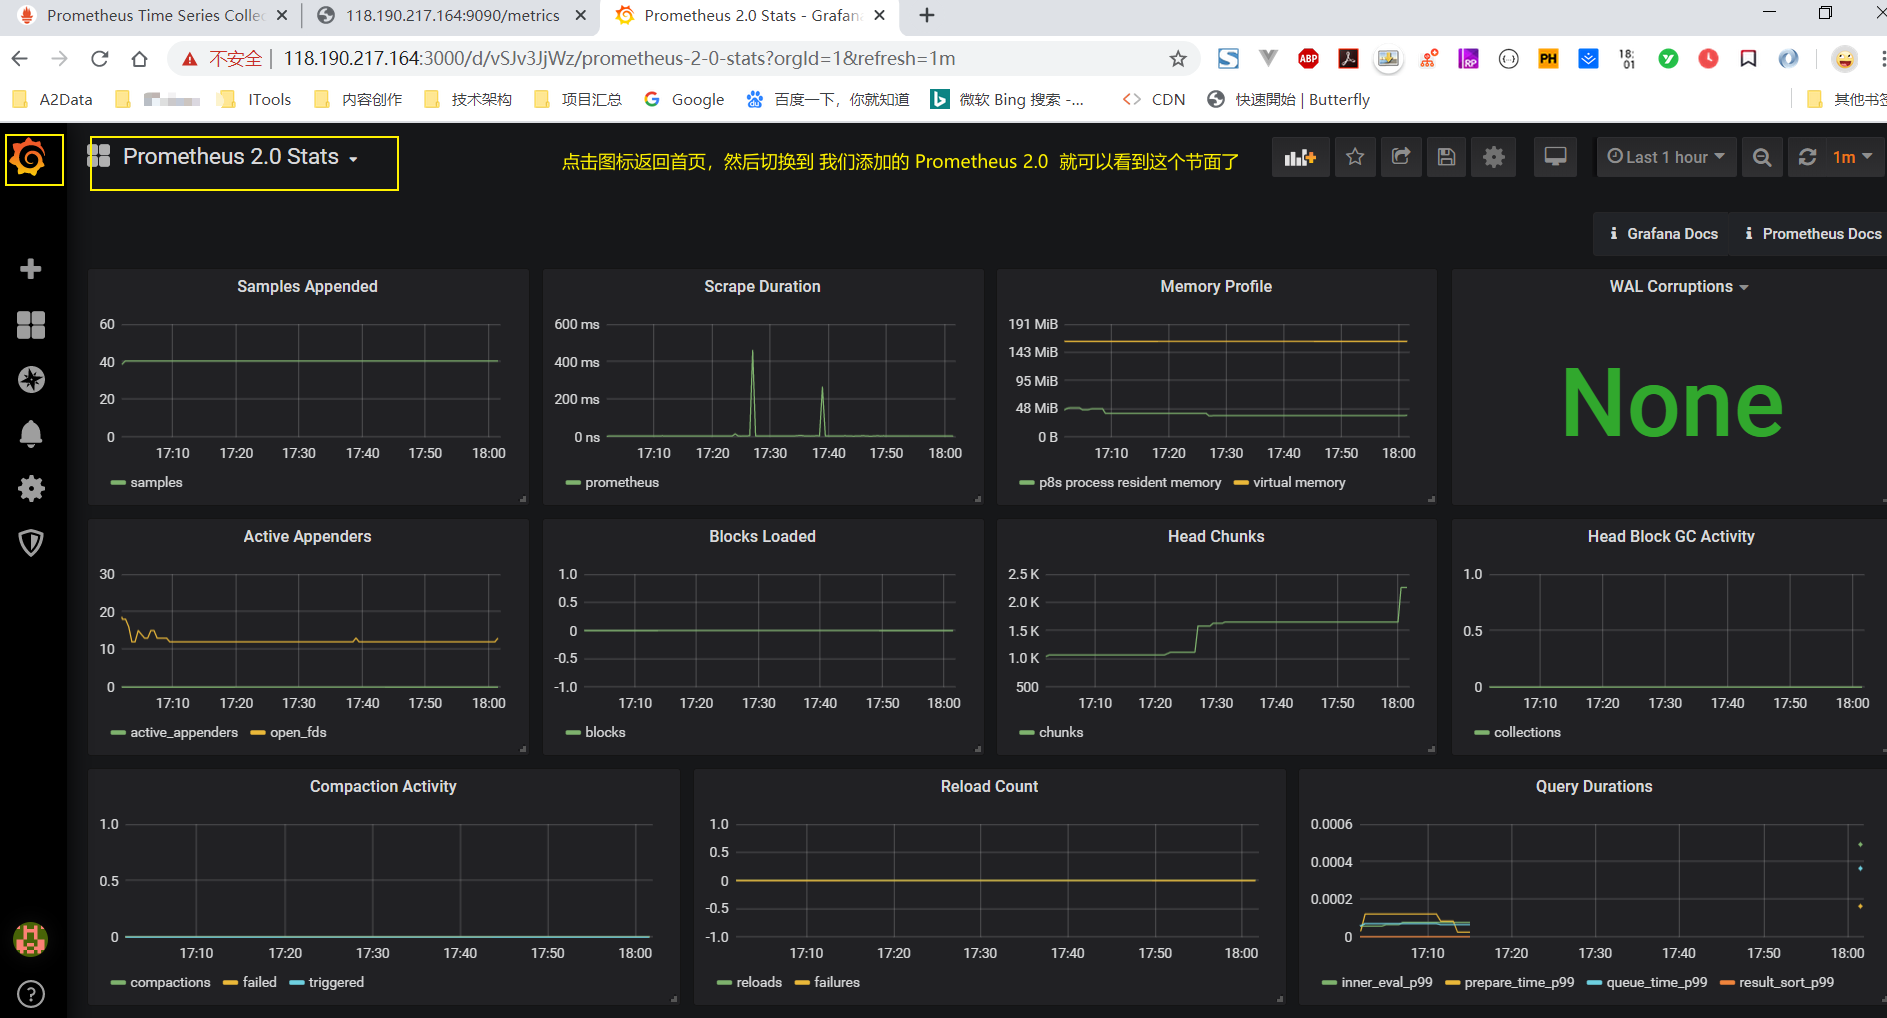
4、繪圖
訪問http://118.190.217.164:9090/metrics查看從exporter具體能抓到的數據,如下圖所示
5、安裝Grafana
普羅米修斯默認的頁面可能沒有那么直觀,我們可以安裝grafana使監控看起來更直觀
wget https://dl.grafana.com/oss/release/grafana-6.1.3-1.x86_64.rpm
# 由於網速比較慢小編從csdn下載的版本

# 實用 yum安裝
yum -y localinstall grafana-6.3.3-1.x86_64.rpm

Grafana的配置文件:
- 配置文件位於
/etc/grafana/grafana.ini,- 這里暫時保持默認配置即可
設置開機啟動
systemctl enable grafana-server
systemctl start grafana-server

添加數據
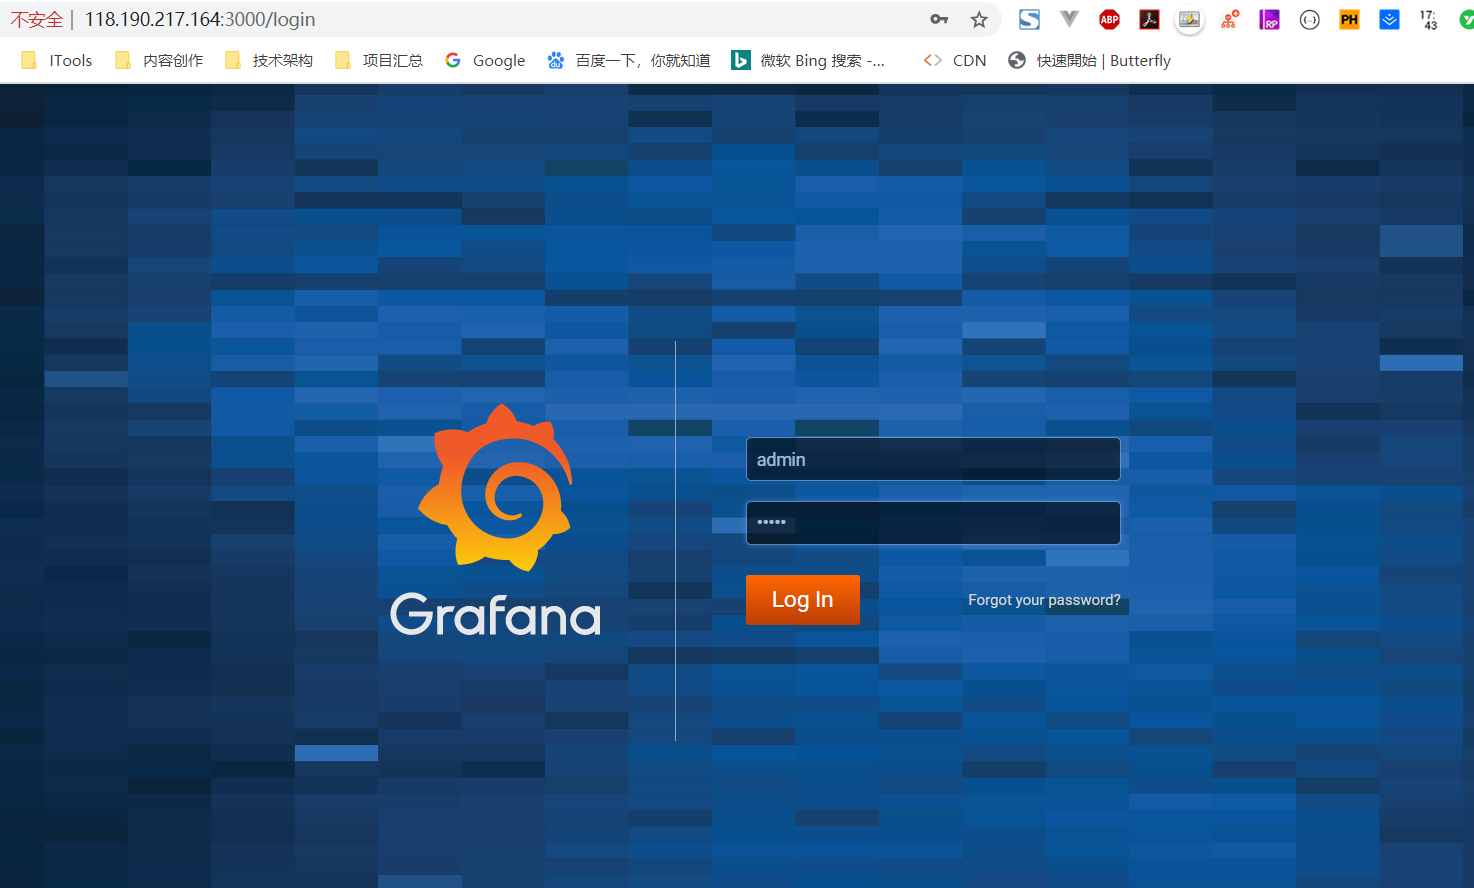
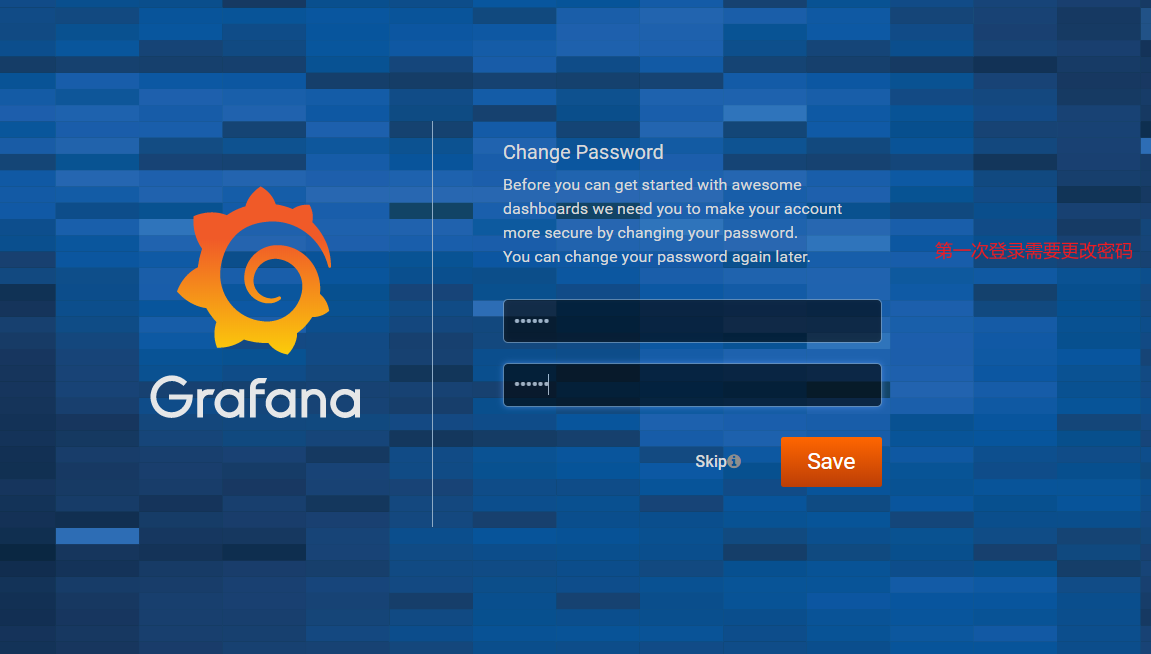
默認登錄后,要求改密碼,可以選擇先跳過
添加數據源
- 1、 點擊 “Add data source”
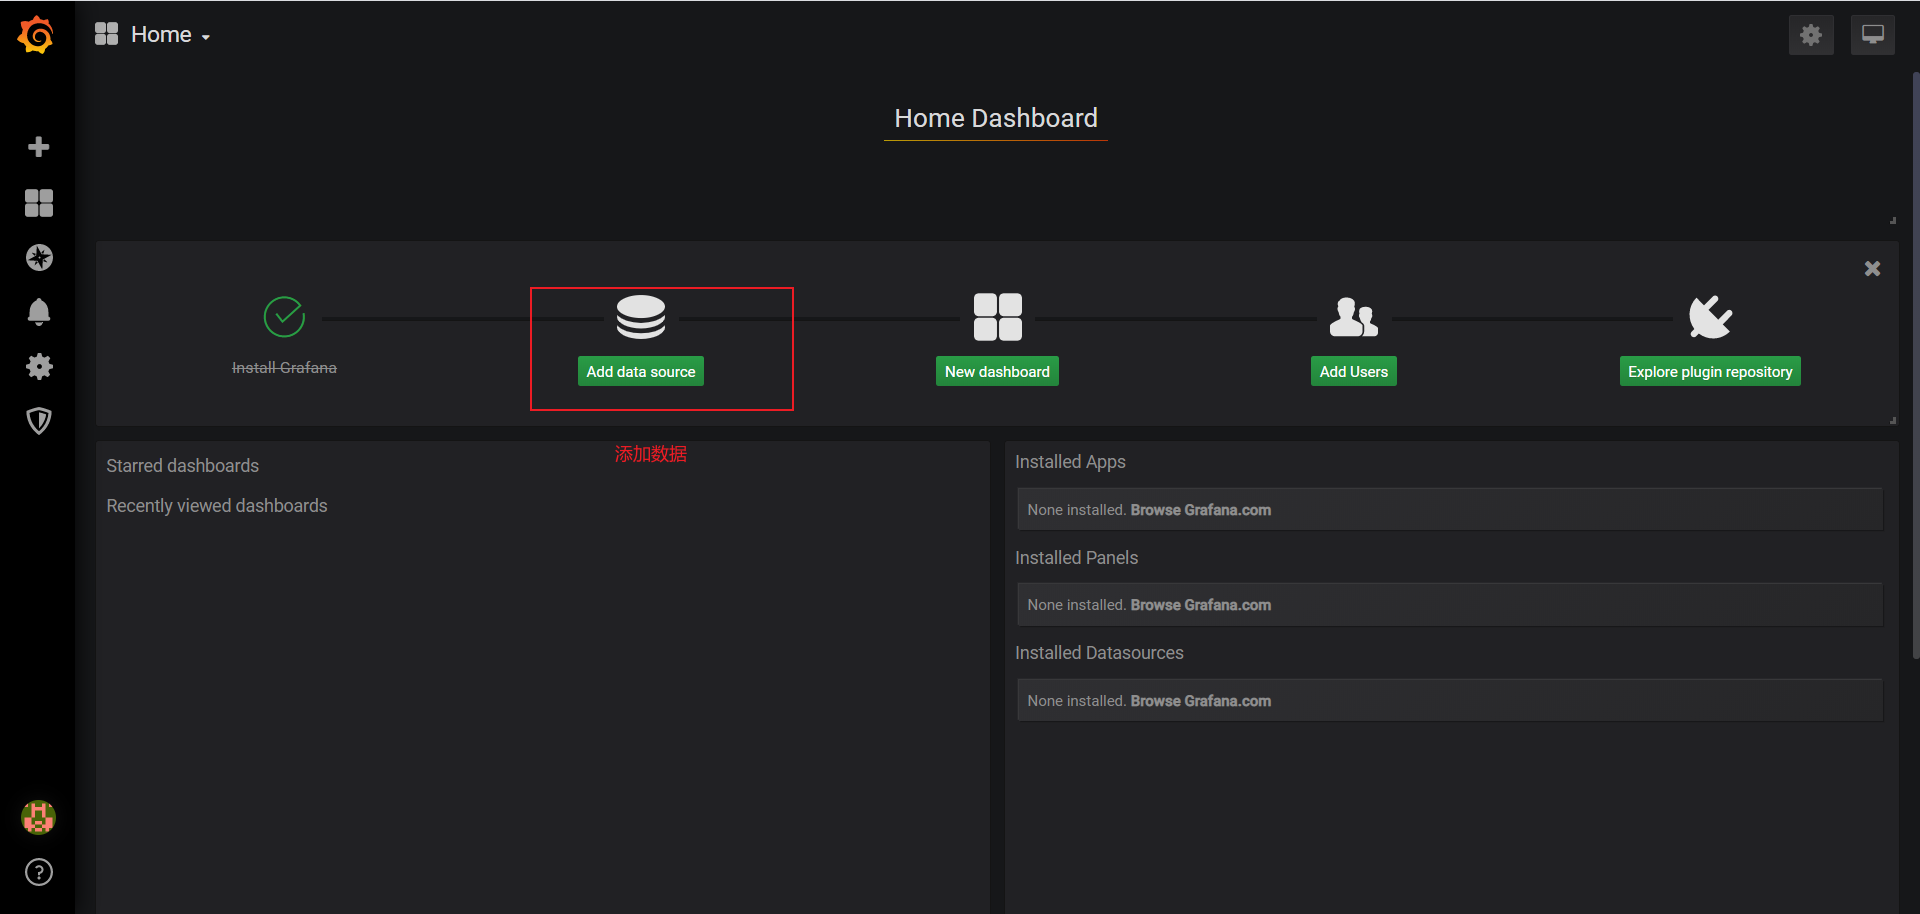
- 2、選擇Prometheus
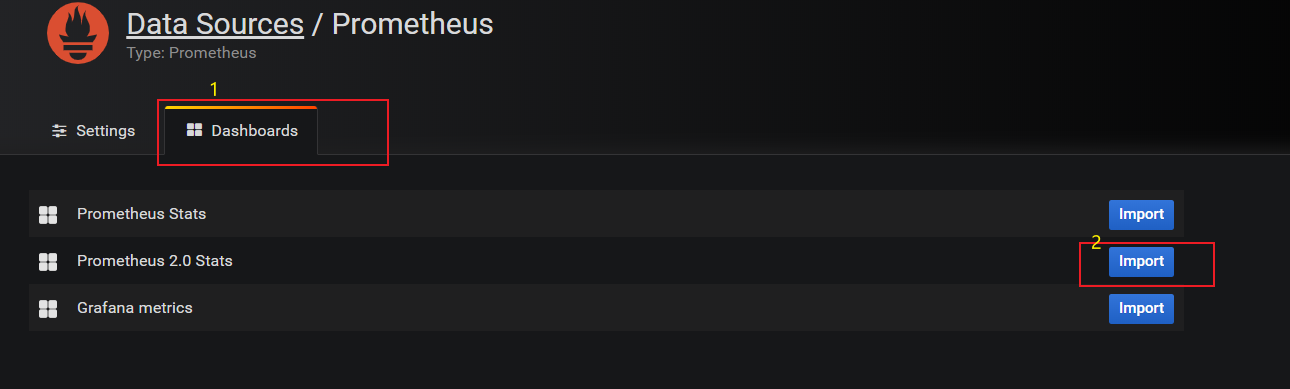

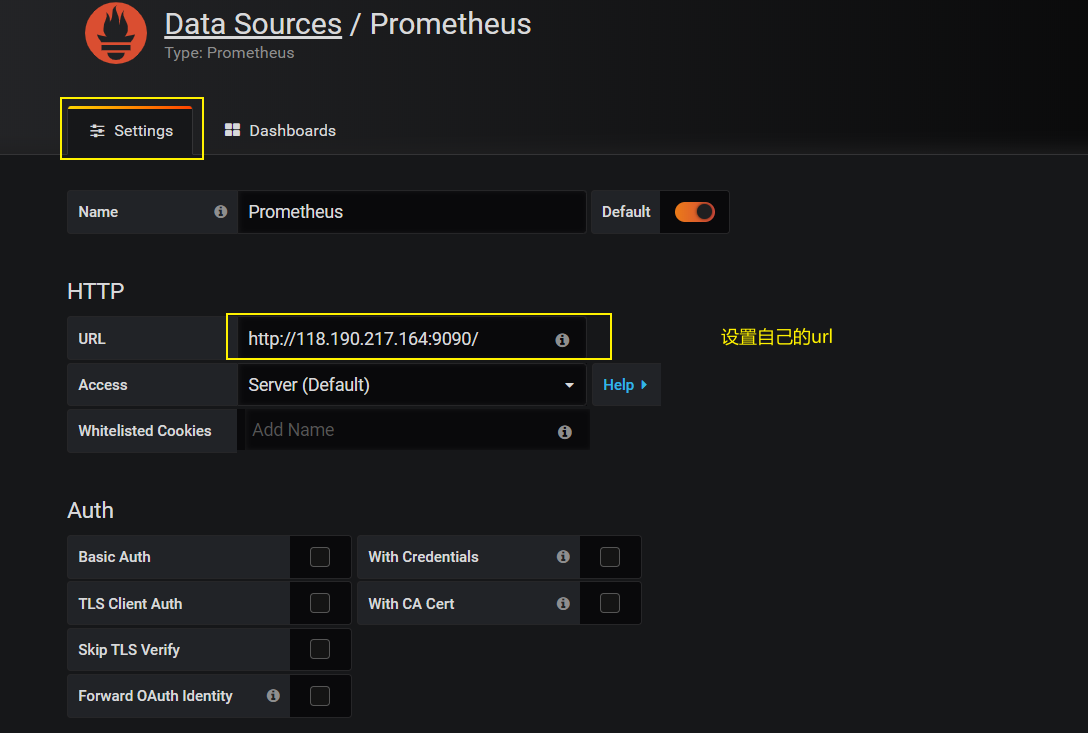
- 3、設置Prometheus地址
- 4、查看監控頁面
拓展網站
- grafana dashboard:https://grafana.com/dashboards
- grafana plugins:https://grafana.com/plugins
系統組件
- Prometheus
- Alertmanager
- *_exproter(多個)
Prometheus
prometheus是最主要的組件,
負責采集數據,發出告警。
命名規則
metric類型
類型:
Counter ----- 累計數值,只能增加或者在重啟時被歸零。
Gauge ----- 瞬時值。
Histogram ---(直方圖)對采集的指標進行分組計數,會生成多個指標,分別帶有后綴
_bucket(僅histogram)、_sum、_count,其中_bucket是區間內計數。Summary ----也會產生多個指標,分別帶有后綴
_bucket(僅histogram)、_sum、_count,可以直接查詢分位數:注意:調用prometheus的sdk創建metrics的時候,必須要明確是哪一種類型的metrics
說明:Histogram和Summary都可以獲取分位數。
分位數本身是用來切分數據的,它們的平均數沒有同樣的分位效果。
Job和Instance
被監控的具體目標是instance,監控這些instances的任務叫做job
每個job負責一類任務,可以為一個job配置多個instance,job對自己的instance執行相同的動作。
隸屬於job的instance可以直接在配置文件中寫死。也可以讓job自動從consul、kuberntes中動態獲取,這個過程就是下文說的服務發現。
配置文件
# my global config

# 全局配置
global:
  scrape_interval:     15s # Set the scrape interval to every 15 seconds. Default is every 1 minute.
  evaluation_interval: 15s # Evaluate rules every 15 seconds. The default is every 1 minute.
  # scrape_timeout is set to the global default (10s).

# Alertmanager configuration
alerting:
  alertmanagers:
  - static_configs:
    - targets:
      # - alertmanager:9093

# Load rules once and periodically evaluate them according to the global 'evaluation_interval'.
rule_files:
  # - "first_rules.yml"
  # - "second_rules.yml"

# A scrape configuration containing exactly one endpoint to scrape:
# Here it's Prometheus itself.

# 指定要監控的目標 ,每一個監控目標是一個job
scrape_configs:
  # The job name is added as a label `job=<job_name>` to any timeseries scraped from this config.
  - job_name: 'prometheus'

    # metrics_path defaults to '/metrics'
    # scheme defaults to 'http'.

    static_configs:
    - targets: ['118.190.217.164:9090']
relabel_config
---擴展采集能力
__address__         : 檢測目標的地址
__scheme__          : http、https等
__metrics_path__    : 獲取指標的路徑

-----------------------------------

- job_name: "user_server_icmp_detect"
  consul_sd_configs:
  - server: "118.190.217.164:8500"
  scheme: http
  metrics_path: /probe
  params:
    module: [icmp]
  relabel_configs:
  - action: keep
    source_labels: [__meta_consul_tags]        #如果__meta_consul_tags匹配正則,則保留該目標
    regex: '.*,icmp,.*'
  - source_labels: [__meta_consul_service]
    regex: '(.+)@(.+)@(.+)'
    replacement: ${2}
    target_label: type
  - source_labels: [__meta_consul_service]
    regex: '(.+)@(.+)@(.+)'
    replacement: ${1}
    target_label: user
  - source_labels: [__address__]
    regex: (.+):(.+)
    replacement: ${1}
    target_label: __param_target
  - target_label: __address__
    replacement:  10.10.199.154:9115
  - source_labels: [__param_target]
    target_label: instance
查詢語句
查詢語句直接就是指標的名稱:
go_memstats_other_sys_bytes但是可以通過標簽篩選:
go_memstats_other_sys_bytes{instance="118.190.217.164"}標簽屬性可以使用4個操作符:
=: Select labels that are exactly equal to the provided string.
!=: Select labels that are not equal to the provided string.
=~: Select labels that regex-match the provided string (or substring).
!~: Select labels that do not regex-match the provided string (or substring).
並且可以使用多個標簽屬性,用“,”間隔,彼此直接是與的關系,下面是prometheus文檔中的一個例子:
http_requests_total{environment=~"staging|testing|development",method!="GET"}甚至只有標簽:
{instance="118.190.217.164"}對查詢出來的結果進行運算也是可以的:
# 時間范圍截取,Range Vector Selectors
http_requests_total{job="prometheus"}[5m]

# 時間偏移
http_requests_total offset 5m

# 時間段內數值累加
sum(http_requests_total{method="GET"} offset 5m)
告警規則配置
alert rules在單獨的文件中定義,然后在prometheus.yml中引用:
rule_files:
  - "first_rules.yml"
  # - "second_rules.yml"
rules文件格式如下:
$ cat first_rules.yml
groups:
- name: rule1-http_requst_total
  rules:
  - alert:  HTTP_REQUEST_TOTAL
    expr: http_requests_total > 100
    for: 1m
    labels:
      severity: page
    annotations:
      summary: Http request total reach limit
需要注意,還要在prometheus.yml中配置alertmanager的地址:
# Alertmanager configuration
alerting:
  alertmanagers:
  - static_configs:
    - targets:
      - 118.190.217.164:9093
重新加載配置文件后,可以在prometheus的rule頁面看到告警規則,在alert頁面看到觸發的告警,
現在alertmanager還沒有部署,在下一節部署了alertmanager之后,告警可以在alertmanager中看到。
Alertmanager
用來接收prometheus發出的告警,然后按照配置文件的要求,將告警用對應的方式發送出去。
部署啟動
wget https://github.com/prometheus/alertmanager/releases/download/v0.15.2/alertmanager-0.15.2.linux-amd64.tar.gz

tar -xvf alertmanager-0.15.2.linux-amd64.tar.gz


解壓得到:
alertmanager  alertmanager.yml  amtool  LICENSE  NOTICE


啟動:
./alertmanager

打開服務:
http://IP地址:9093/#/alerts
配置文件
global:
  resolve_timeout: 5m

route:
  group_by: ['alertname']
  group_wait: 10s
  group_interval: 10s
  repeat_interval: 1h
  receiver: 'web.hook'
receivers:
- name: 'web.hook'
  webhook_configs:
  - url: 'http://118.190.217.164:5001/'
inhibit_rules:
  - source_match:
      severity: 'critical'
    target_match:
      severity: 'warning'
    equal: ['alertname', 'dev', 'instance']
告警方式
email_config
hipchat_config
pagerduty_config
pushover_config
slack_config
opsgenie_config
victorops_config
webhook_config   ---- 將郵件發送到這個url
wechat_config
郵件通知
這里給出一個用郵件通知告警的例子,發件郵箱用的是網易郵箱:
global:
  resolve_timeout: 5m
route:
  group_by: ['alertname']
  group_wait: 10s
  group_interval: 10s
  repeat_interval: 1h
  receiver: 'mail'
receivers:
- name: 'web.hook'
  webhook_configs:
  - url: 'http://118.190.217.164:5001/'
- name: 'mail'
  email_configs:
  - to: 接收告警用的郵箱
    from: 你的發件用的網易郵箱
    smarthost:  smtp.163.com:25
    auth_username: 網易郵箱賬號
    auth_password: 網易郵箱密碼
    # auth_secret:
    # auth_identity:
inhibit_rules:
  - source_match:
      severity: 'critical'
    target_match:
      severity: 'warning'
    equal: ['alertname', 'dev', 'instance']
注意這里有web.hook和mail兩個reciver,使用哪個receive是在上面的router中配置的:
route:
  group_by: ['alertname']
  group_wait: 10s
  group_interval: 10s
  repeat_interval: 1h
  receiver: 'mail'
重新加載配置后,就可以收到告警郵件了。
集群模式
什么是集群模式?
即多個alaertmanager一起運行,彼此之間通過gossip協議獲知告警的處理狀態,防止告警重復發出。
如何配置:
- 使用gossip協議
- 啟動時指定一個或者多個 alertmanager的地址
--cluster.peer=118.190.217.164:9094
*__exporter
exporter 是一組程序,作用:
- 采集物理機
- 中間件的信息
- rometheus官方 支持
- 也有第三方支持的
系統指標
Databases
    Aerospike exporter
    ClickHouse exporter
    Consul exporter (official)
    CouchDB exporter
    ElasticSearch exporter
    EventStore exporter
...
Hardware related
    apcupsd exporter
    Collins exporter
    IoT Edison exporter
...
Messaging systems
    Beanstalkd exporter
    Gearman exporter
    Kafka exporter
...
Storage

    Ceph exporter
    Ceph RADOSGW exporter
...
HTTP

    Apache exporter
    HAProxy exporter (official)
...
APIs
    AWS ECS exporter
    AWS Health exporter
    AWS SQS exporter
Logging

    Fluentd exporter
    Google's mtail log data extractor
...
Other monitoring systems
    Akamai Cloudmonitor exporter
    AWS CloudWatch exporter (official)
    Cloud Foundry Firehose exporter
    Collectd exporter (official)
...
Miscellaneous

    ACT Fibernet Exporter
    Bamboo exporter
    BIG-IP exporter
...
blackbox_exporter
主要作用於探測url、domain等聯通、響應情況的exporter。
部署啟動
#下載壓縮包
https://github.com/prometheus/blackbox_exporter/releases/download/v0.12.0/blackbox_exporter-0.12.0.linux-amd64.tar.gz

# 解壓
tar xf blackbox_exporter-0.12.0.linux-amd64.tar.gz

# 直接運行,默認監聽地址是:9115
配置文件
modules:
  http_2xx:
    prober: http
    http:
  http_post_2xx:
    prober: http
    http:
      method: POST
  tcp_connect:
    prober: tcp
  pop3s_banner:
    prober: tcp
    tcp:
      query_response:
      - expect: "^+OK"
      tls: true
      tls_config:
        insecure_skip_verify: false
  ssh_banner:
    prober: tcp
    tcp:
      query_response:
      - expect: "^SSH-2.0-"
  irc_banner:
    prober: tcp
    tcp:
      query_response:
      - send: "NICK prober"
      - send: "USER prober prober prober :prober"
      - expect: "PING :([^ ]+)"
        send: "PONG ${1}"
      - expect: "^:[^ ]+ 001"
  icmp:
    prober: icmp
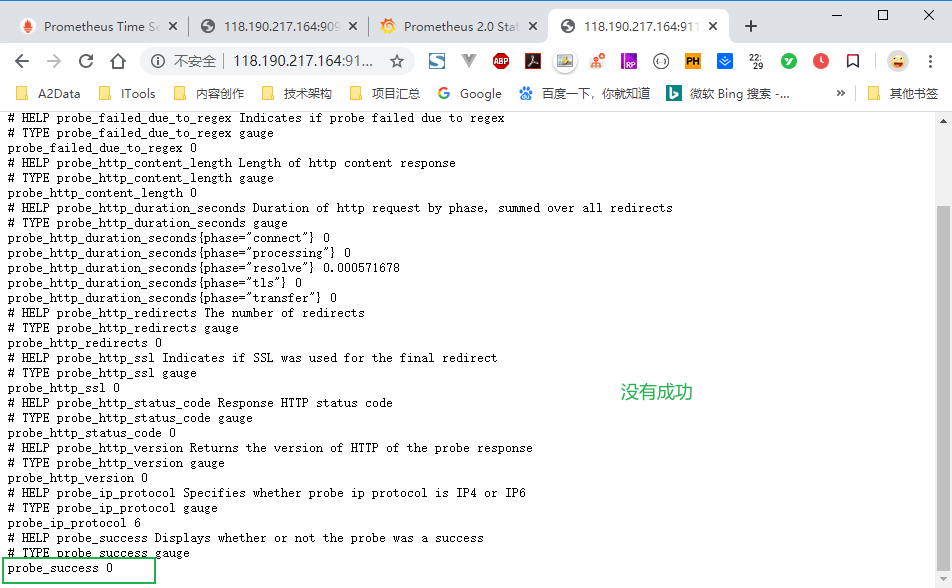
案例獲取百度指標
例如要獲取域名
www.baidu.com的指標,要用http_2xx模塊,傳入參數www.baidu.com:小編嘗試 失敗應該是 阿里雲端口限制的問題。
http://118.190.217.164:9115/probe?module=http_2xx&target=http%3A%2F%2Fwww.baidu.com%2F
其他配置
運算[Operators: https://prometheus.io/docs/prometheus/latest/querying/operators/
# 容器CPU負載告警
# container_cpu_load_average_10s, container_spec_cpu_quota, container_spec_cpu_shares, container_spec_cpu_quota
# 容器CPU limit: container_spec_cpu_quota / container_spec_cpu_period
# 計算空間的CPU使用率:sum(rate(container_cpu_usage_seconds_total{namespace=~".+"}[1m])) by (namespace) * 100
# 計算容器CPU使用率:sum(rate(container_cpu_usage_seconds_total{name=~".+"}[1m])) by (name) * 100
# rate(container_cpu_usage_seconds_total{name=~".+"}[1m])
計算容器的內存使用率:
container_memory_usage_bytes{container_name!="", pod_name!=""} / container_spec_memory_limit_bytes{container_name!="", pod_name!=""}

container_memory_usage_bytes{instance="prod-k8s-node-155-171",container_name!="", pod_name!=""} / container_spec_memory_limit_bytes{instance="prod-k8s-node-155-171",container_name!="", pod_name!=""}

container_memory_usage_bytes{container_name!="", pod_name!=""} / container_spec_memory_limit_bytes{container_name!="", pod_name!=""} > 0.98

container_memory_rss{container_name!="", pod_name!=""}/container_spec_memory_limit_bytes{container_name!="", pod_name!=""} >0.98