簡介
在實際的配置中,經常會遇到增加或者減少監控主機的狀況,如果每次都需要修改
prometheus.yml配置文件,實在是太麻煩了。
此時就需要配置自動發現,而prometheus只是很多種的自動發現
支持:
- 基於公有雲
- 基於私有雲
- 基於文件,file的自動發現
- 基於DNS 的自動發現,分為SRV解析自動發現和A記錄解析的自動發現
........等等,有很多類型,本文中介紹基於靜態文件 和 DNS 的自動發現
環境說明
增加一台 10.0.20.12 node_export 主機及DNS使用的是bind9
如需bind9 文檔,點擊這里是bind9文檔
以下的所有演示都是案例,可根據自己的情況做變更。
靜態配置
簡單講解下直接修改prometheus.yml主配置文件中的靜態配置。
修改配置如下:
[root@es01 config]# cat prometheus.yml
global:
  scrape_interval:     15s
  evaluation_interval: 15s
alerting:
  alertmanagers:
  - static_configs:
    - targets:

rule_files:

scrape_configs:
  - job_name: 'prometheus'
    static_configs:
    - targets: ['localhost:9090']

  - job_name: 'node'                # 增加一個節點,取名為 node
    metrics_path: '/metrics'        # 獲取數據的路徑 http://10.0.20.12:9100/metrics
    static_configs:
    - targets: ['10.0.20.12:9100']  # 靜態配置 node 節點的地址
重新加載配置文件
檢查配置文件,並重新加載
# 檢查配置文件
[root@es01 config]# /opt/prometheus-2.14/bin/promtool check config /opt/prometheus-2.14/config/prometheus.yml
Checking /opt/prometheus-2.14/config/prometheus.yml
  SUCCESS: 0 rule files found

# 重新加載配置文件
[root@es01 config]# curl -X POST httP://10.0.20.11:9090/-/reload
[root@es01 config]#
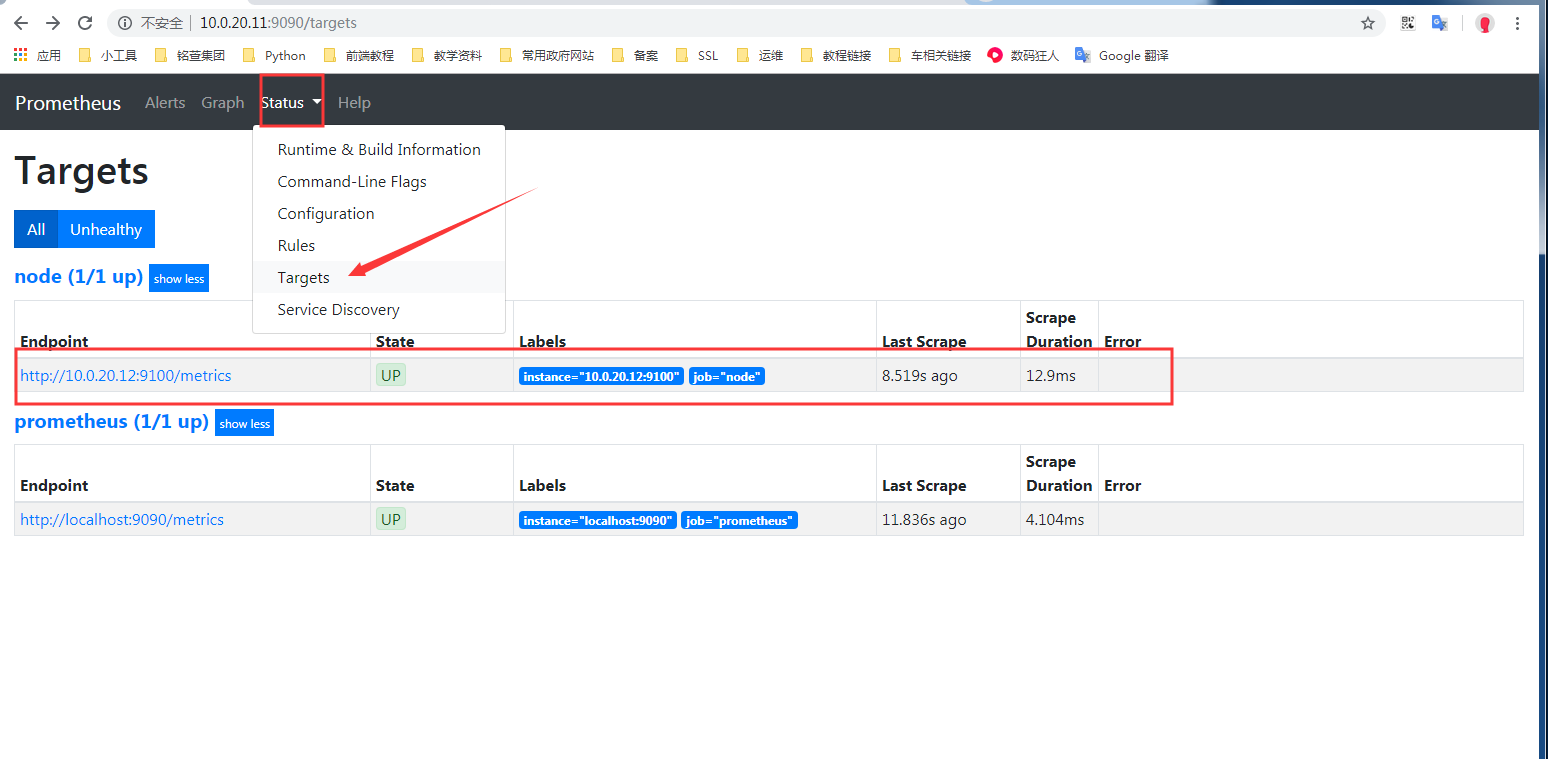
再次訪問效果如下
基於文件發現配置
創建對應的目錄
[root@es01 config]# pwd
/opt/prometheus-2.14/config
# 創建targets目錄,並且創建對應的子目錄,用於存放相應的配置文件自動發現
[root@es01 config]# mkdir targets/{docker,nodes}
[root@es01 config]# ls targets/
docker  nodes
在創建好的nodes目錄下創建 nodes.json文件,並寫入下面內容
[root@es01 config]# cat targets/nodes/nodes.json
[{
  "targets": [
    "10.0.20.12:9100"           # 指定node_export鏈接地址
  ],
  "labels": {
    "server": "node_export01"   # 添加一個標簽
  }
}]
修改配置文件如下:
[root@es01 config]# cat prometheus.yml
global:
  scrape_interval:     15s
  evaluation_interval: 15s
alerting:
  alertmanagers:
  - static_configs:
    - targets:

rule_files:

scrape_configs:
  - job_name: 'prometheus'
    static_configs:             # 這個配置表示 靜態發現
    - targets: ['localhost:9090']

  - job_name: 'node'            # 增加一個節點,取名為 node
    metrics_path: "/metrics"    # 獲取數據的路徑 http://10.0.20.12:9100/metrics
    file_sd_configs:            # 這個配置表示通過文件發現
    - files:
      - targets/nodes/*.json    # 讀取目錄下的所有json結尾的文件
      refresh_interval: 1m      # 刷新頻率,1 分鍾
重新加載配置文件
檢查配置文件,並重新加載
# 檢查配置文件
[root@es01 config]# /opt/prometheus-2.14/bin/promtool check config /opt/prometheus-2.14/config/prometheus.yml
Checking /opt/prometheus-2.14/config/prometheus.yml
  SUCCESS: 0 rule files found

# 重新加載配置文件
[root@es01 config]# curl -X POST httP://10.0.20.11:9090/-/reload
[root@es01 config]#
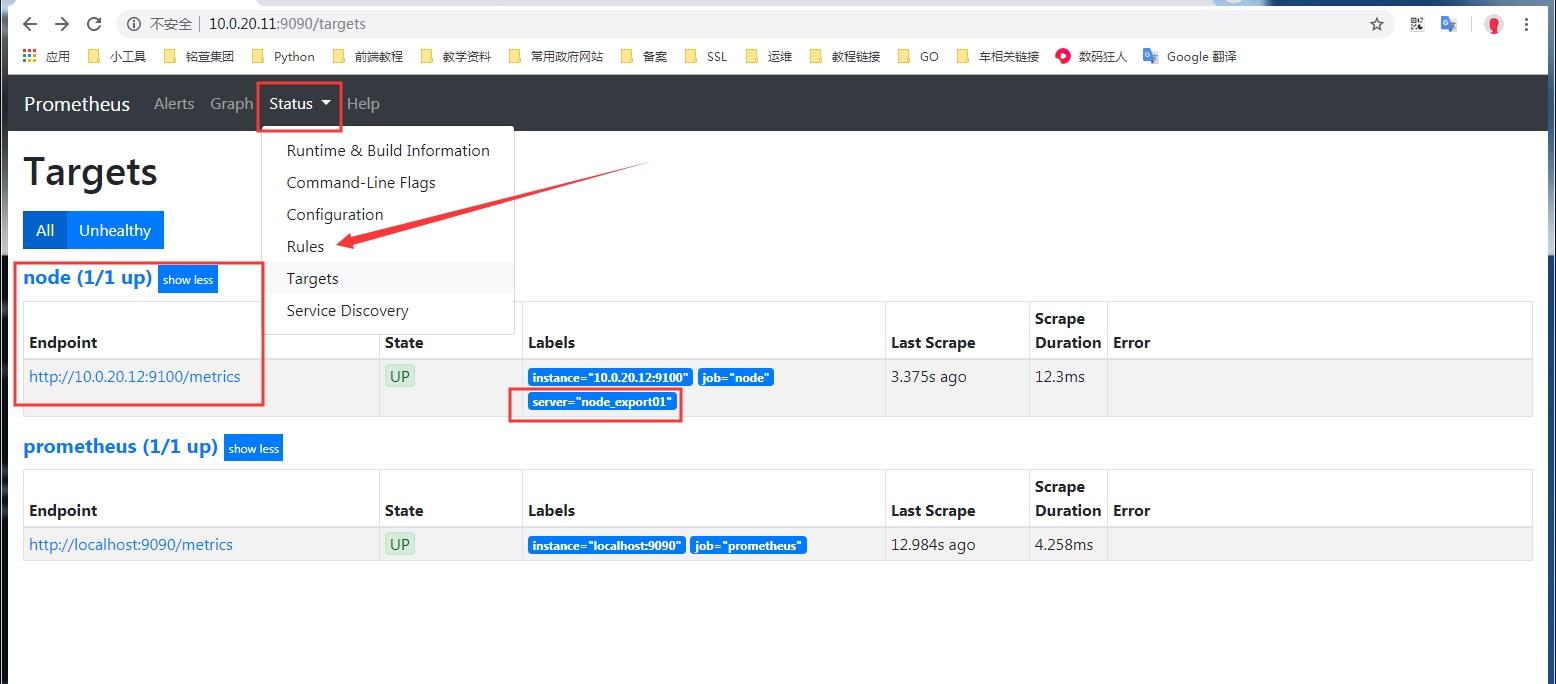
可以看到,獲取到了主機監控,並且能看到增加標簽
添加主機測試
在配置文件 targets/nodes/nodes.json 中添加一台主機。
在前面的文檔中,prometheus 主機也部署了node_export ,這里添加測試
[{
  "targets": [
    "10.0.20.11:9100",
    "10.0.20.12:9100"
  ],
  "labels": {
    "server": "node_export01"
  }
}]
當編輯文件 targets/nodes/nodes.json 后保存,再次訪問頁面時,新增加的主機已經自動加入
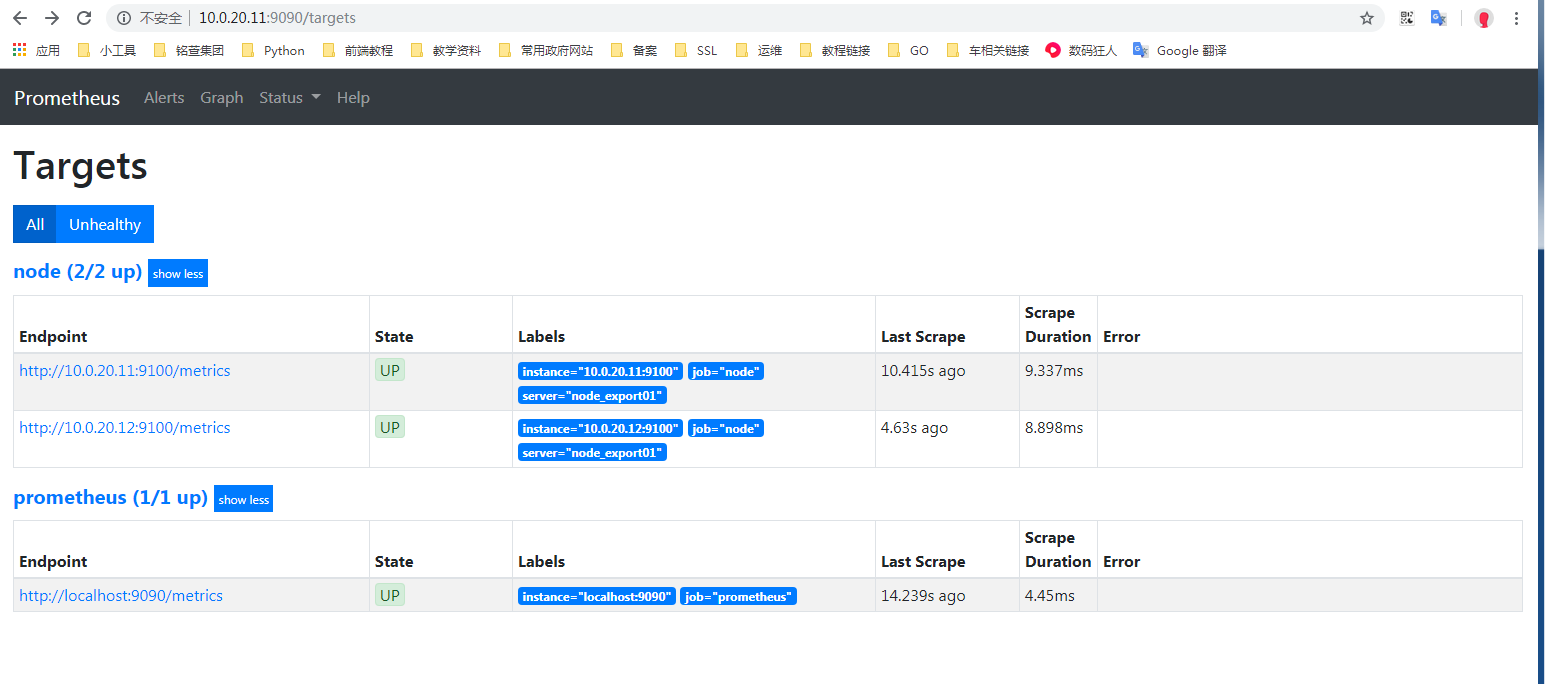
簡單總結: 定義好對應的主配置文件prometheus.yml后,后續要添加新的node節點監控進來,只需要增加node.json內容即可,也不需要重載prometheus服務,相對比較簡單的基於文件的自動發現。
基於DNS的A記錄
首先要在內網DNS上添加A記錄解析:
[root@es01 config]# nslookup es01.k8s.com
Server:		192.168.1.122
Address:	192.168.1.122#53

Name:	es01.k8s.com
Address: 10.0.20.11         # 解析后的地址

[root@es01 config]# nslookup es02.k8s.com
Server:		192.168.1.122
Address:	192.168.1.122#53

Name:	es02.k8s.com
Address: 10.0.20.12         # 解析后的地址
這里添加了兩條A記錄
修改配置文件
[root@es01 config]# cat prometheus.yml
global:
  scrape_interval:     15s
  evaluation_interval: 15s
alerting:
  alertmanagers:
  - static_configs:
    - targets:

rule_files:

scrape_configs:
  - job_name: 'prometheus'
    static_configs:
    - targets: ['localhost:9090']

  - job_name: 'node-A'                  # 名稱
    metrics_path: "/metrics"            # 獲取數據的路徑 http://10.0.20.12:9100/metrics
    dns_sd_configs:
    - names: ["es01.k8s.com", "es02.k8s.com"]   # 這里填寫A記錄
      type: A                                   # 解析類型 A記錄
      port: 9100                                # 端口
重新加載配置文件
檢查配置文件,並重新加載
# 檢查配置文件
[root@es01 config]# /opt/prometheus-2.14/bin/promtool check config /opt/prometheus-2.14/config/prometheus.yml
Checking /opt/prometheus-2.14/config/prometheus.yml
  SUCCESS: 0 rule files found

# 重新加載配置文件
[root@es01 config]# curl -X POST httP://10.0.20.11:9090/-/reload
[root@es01 config]#
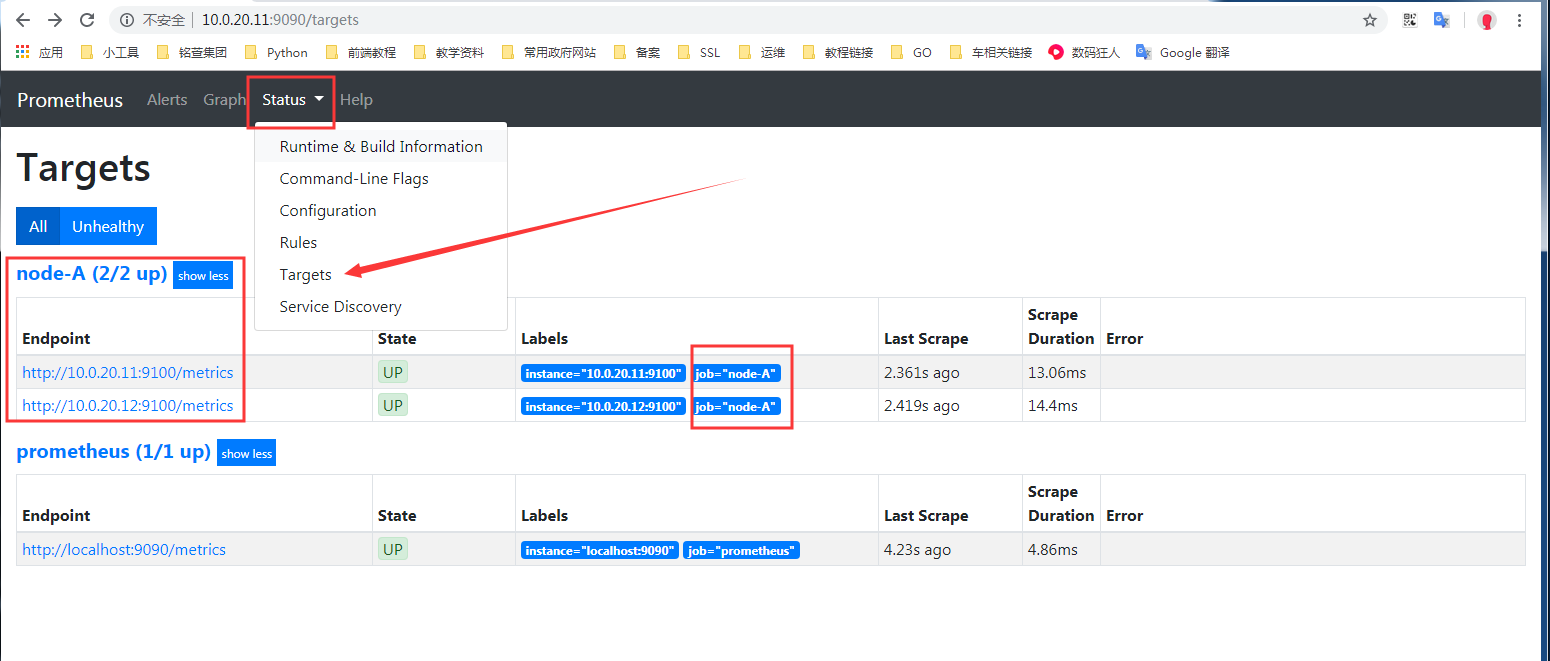
通過上圖可以看出添加成功。
基於DNS的SRV記錄自動發現
需要在DNS中添加SRV解析記錄,下面演示在bind9中添加后測試
首先要在內網DNS上添加A記錄解析:
[root@es01 config]# nslookup es01.k8s.com
Server:		192.168.1.122
Address:	192.168.1.122#53

Name:	es01.k8s.com
Address: 10.0.20.11         # 解析后的地址
然后添加SRV記錄:
[root@bind named]# cat k8s.com.zone
es01    IN      A       10.0.20.11
_prometheus._tcp.k8s.com.       IN      SRV     10      10      9100    es01
上述是在bind中添加的對應的A記錄和SRV記錄
解析SRV記錄測試
[root@es01 config]# dig @192.168.1.122 +noall +answer SRV _prometheus._tcp.k8s.com
_prometheus._tcp.k8s.com. 86400	IN	SRV	10 10 9100 es01.k8s.com.
能夠解析到上述內容,則表示SRV記錄添加正常
注意,先添加es01,之后測試添加SRV后,prometheus能否動態添加進監控
修改配置文件
[root@es01 config]# cat prometheus.yml
global:
scrape_interval: 15s
evaluation_interval: 15s
alerting:
alertmanagers:
- static_configs:
- targets:
rule_files:
scrape_configs:
- job_name: 'prometheus'
static_configs:
- targets: ['localhost:9090']
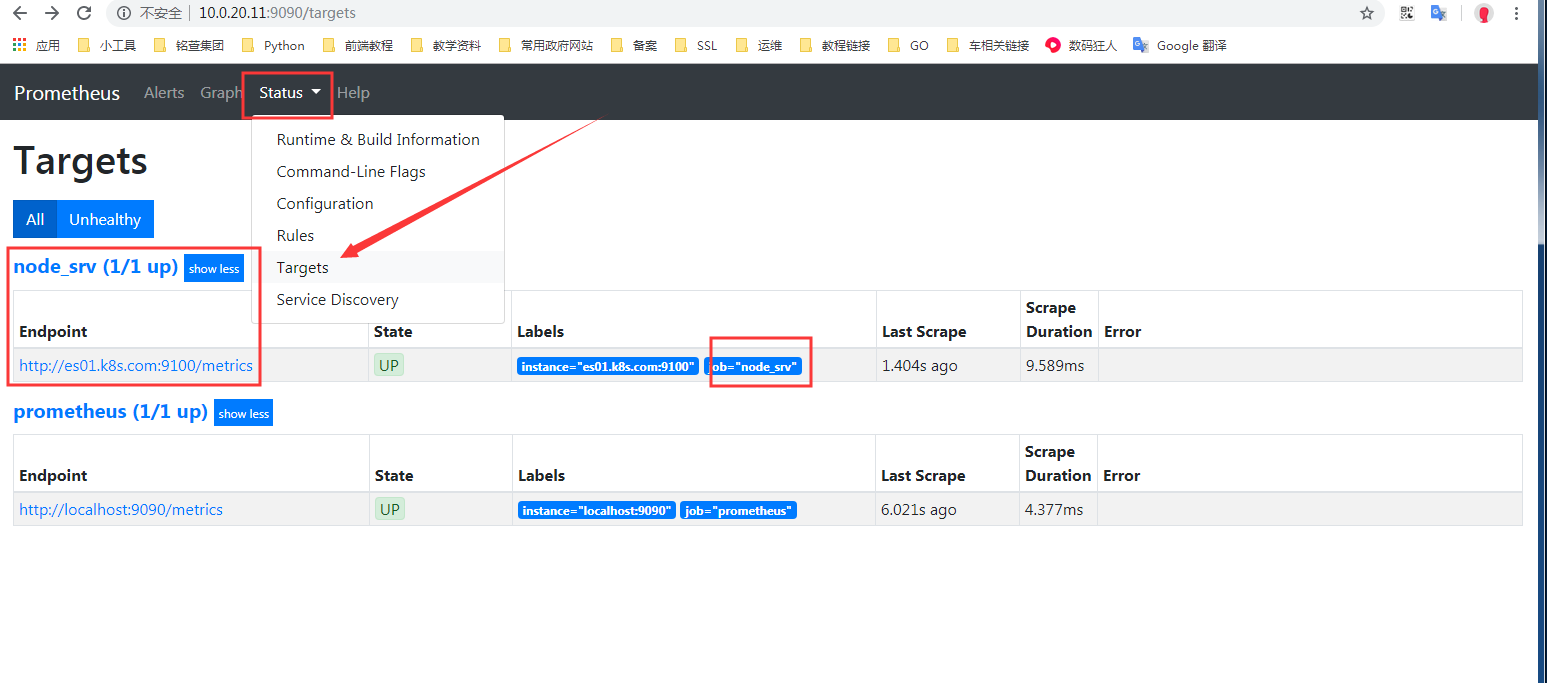
- job_name: 'node_srv' # 名稱
metrics_path: "/metrics" # 獲取數據的路徑 http://10.0.20.12:9100/metrics
dns_sd_configs: # 配置使用DNS解析
- names: ['_prometheus._tcp.k8s.com'] # 配置SRV對應的解析地址
重新加載配置文件
檢查配置文件,並重新加載
# 檢查配置文件
[root@es01 config]# /opt/prometheus-2.14/bin/promtool check config /opt/prometheus-2.14/config/prometheus.yml
Checking /opt/prometheus-2.14/config/prometheus.yml
  SUCCESS: 0 rule files found

# 重新加載配置文件
[root@es01 config]# curl -X POST httP://10.0.20.11:9090/-/reload
[root@es01 config]#
動態添加解析測試
上面通過SRV已經可以監控了,這里再次測試下,添加一條SRV記錄后,prometheus是否能夠自動添加
添加記錄並測試
首先要在內網DNS上添加A記錄解析:
[root@es01 config]# nslookup es01.k8s.com
Server:		192.168.1.122
Address:	192.168.1.122#53

Name:	es01.k8s.com
Address: 10.0.20.11         # 解析后的地址

[root@es01 config]# nslookup es02.k8s.com
Server:		192.168.1.122
Address:	192.168.1.122#53

Name:	es02.k8s.com
Address: 10.0.20.12         # 解析后的地址
然后添加SRV記錄:
[root@bind named]# cat k8s.com.zone
es01    IN      A       10.0.20.11
es02    IN      A       10.0.20.12
_prometheus._tcp.k8s.com.       IN      SRV     10      10      9100    es01
_prometheus._tcp.k8s.com.       IN      SRV     10      10      9100    es02
上述是在bind中添加的對應的A記錄和SRV記錄
解析SRV記錄測試
[root@es01 config]# dig @192.168.1.122 +noall +answer SRV _prometheus._tcp.k8s.com
_prometheus._tcp.k8s.com. 86400	IN	SRV	10 10 9100 es01.k8s.com.
_prometheus._tcp.k8s.com. 86400	IN	SRV	10 10 9100 es02.k8s.com.
添加SRV解析成功后訪問測試:
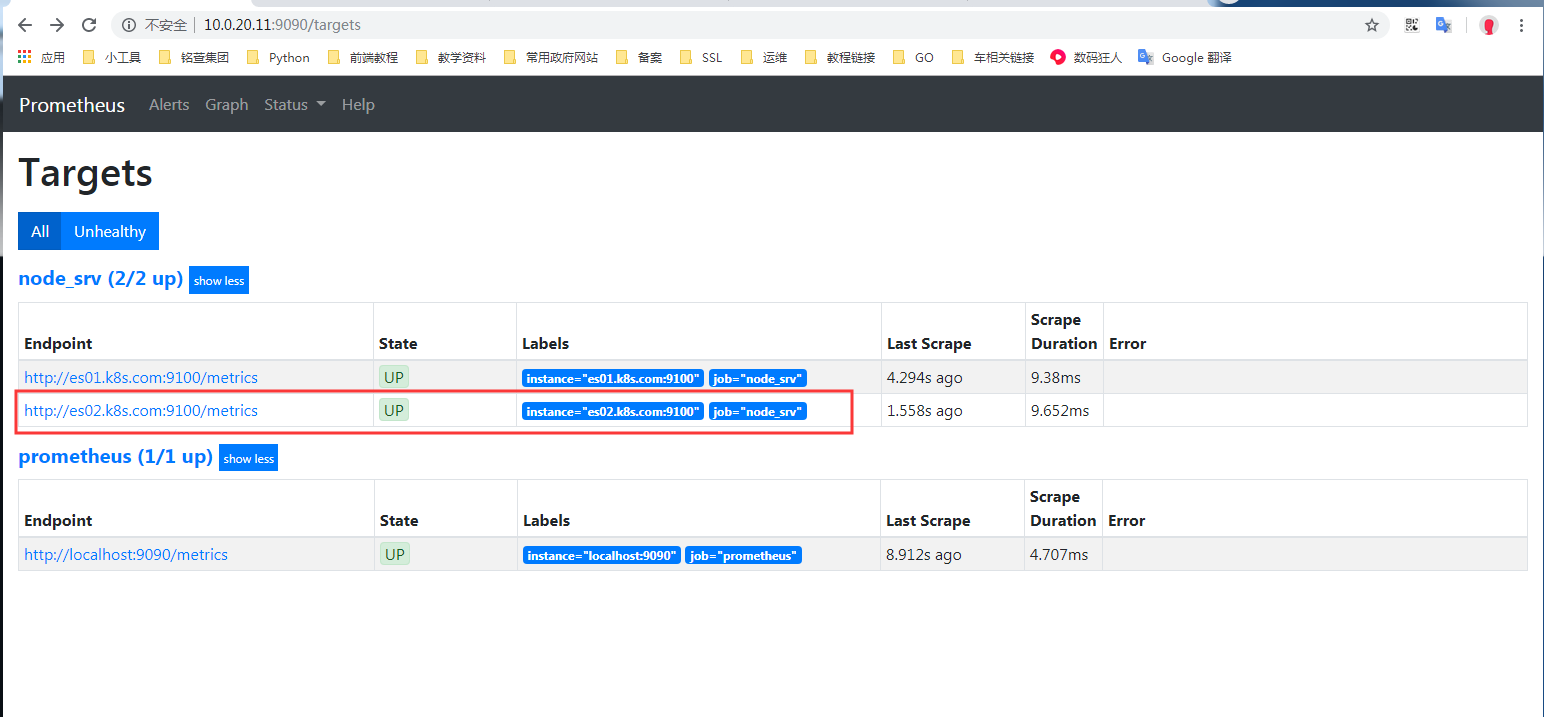
上圖中展示,已自動添加成功。