安裝
npm install echarts --save
npm install @types/echarts --save
基本使用
定義一個dom
<div id="chart" style="min-width: 1500px;min-height:800px;"></div>
定義對象
//數據
eChartDatas: any;
//圖例
legends:any;

//echart
echarts: any;
myChart: any;
獲得echarts對象
// 基於准備好的dom,初始化echarts實例
this.echarts = require('echarts');
//只能初始化一次:https://www.echartsjs.com/api.html#echarts.init
if (this.myChart == null || this.myChart == undefined) {
  this.myChart = this.echarts.init(document.getElementById('chart') as HTMLDivElement);
}
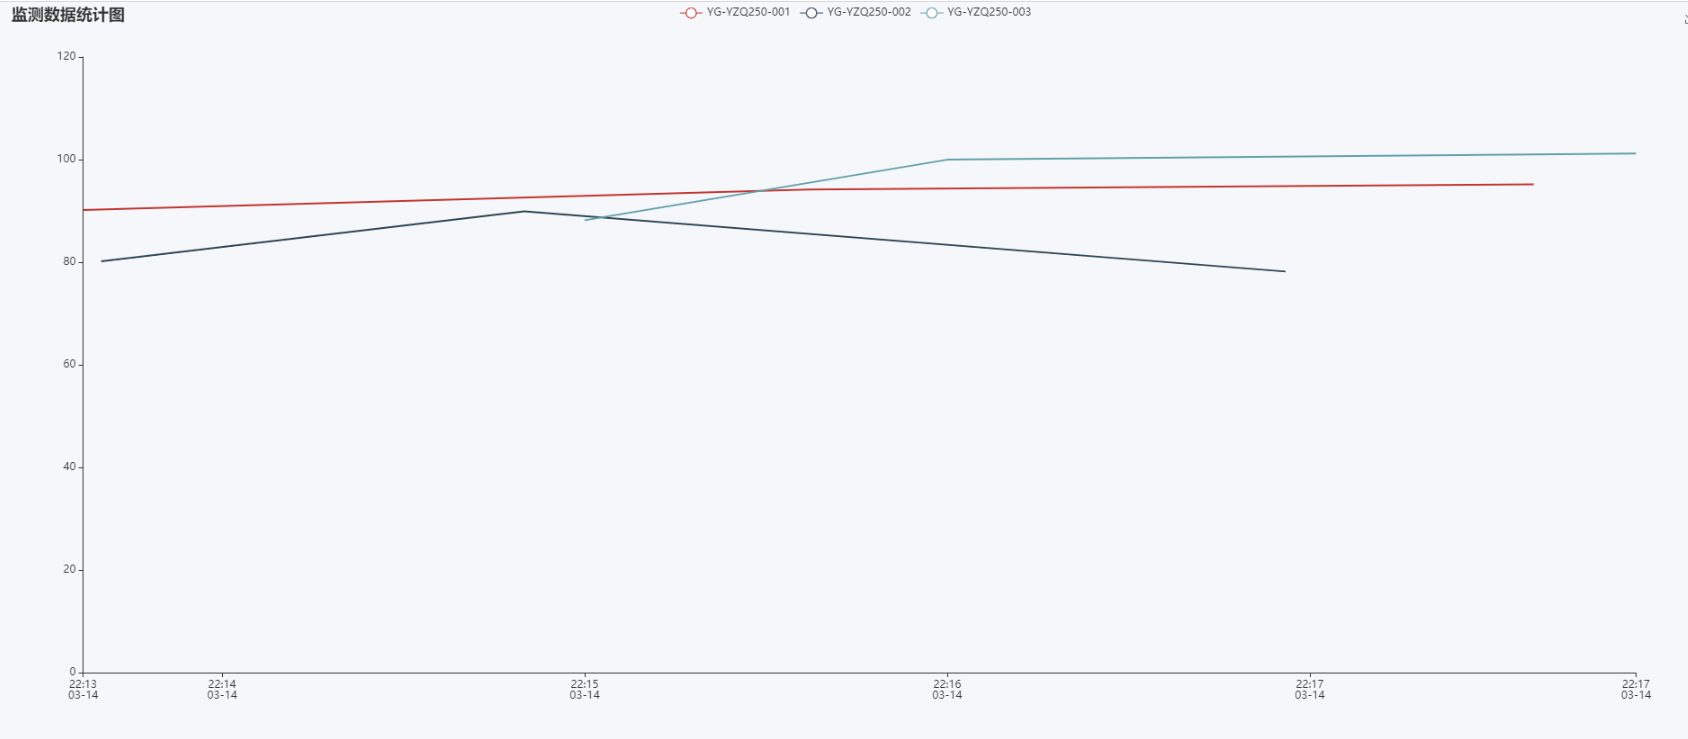
多折線圖生成
效果如圖
//繪制chart
// 指定圖表的配置項和數據
var option = {
	//標題
	title: {
	text: '監測數據統計圖',
	// left: 'center'
	},
	//圖例
	legend: {
		data: this.legends
	},
	tooltip: {
	trigger: 'axis',
	grid: {
	left: '3%',
	right: '4%',
	bottom: '3%',
	containLabel: true
	},
	toolbox: {
	feature: {
		saveAsImage: {}
	}
	},
	xAxis: {
	type: 'time',
	splitLine: {
		show: false
	}
	},
	yAxis: {
	type: 'value',
	splitLine: {
		show: false
	}
	},
	series: []
};
//循環錄入數據
this.eChartDatas.forEach(dataList => {
	option.series.push({
	name: dataList[0].tip,
	type: 'line',
	showSymbol: false,
	hoverAnimation: false,
	data: dataList
	});
});

// 使用剛指定的配置項和數據顯示圖表。
this.myChart.clear();
this.myChart.setOption(option);
示例代碼
參考資料
Is it possible to use ECharts Baidu with Angular 2 and TypeScript
Ionic2系列——在Ionic2中使用ECharts
echarts demo
echarts 多折線demo