一:准備
1.1:安裝sysstat
yum -y install sysstat
1.2:安裝zabbix-get
yum install -y zabbix-get.x86_64
1.3:iostat
iostat常用參數說明 -c #僅顯示CPU統計信息.與-d選項互斥. -d #僅顯示磁盤統計信息.與-c選項互斥. -k #以K為單位顯示每秒的磁盤請求數,默認單位塊. -t #在輸出數據時,打印搜集數據的時間. -V #打印版本號和幫助信息. -x #輸出擴展信息. 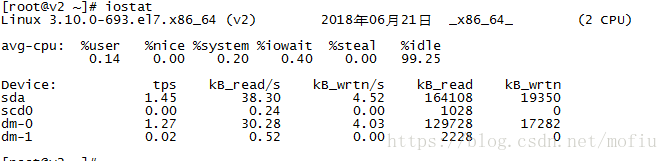 avg-cpu段: %user: 在用戶級別運行所使用的CPU的百分比. %nice: nice操作所使用的CPU的百分比. %sys: 在系統級別(kernel)運行所使用CPU的百分比. %iowait: CPU等待硬件I/O時,所占用CPU百分比. %idle: CPU空閑時間的百分比. Device段: tps: 每秒鍾發送到的I/O請求數. Blk_read /s: 每秒讀取的block數. Blk_wrtn/s: 每秒寫入的block數. Blk_read: 讀入的block總數. Blk_wrtn: 寫入的block總數. 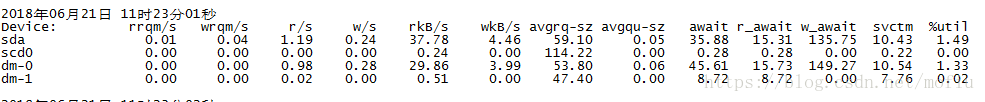 rrqm/s:每秒讀請求被合並次數 wrqm/s:每秒寫請求被合並次數 r/s:每秒完成的讀次數 w/s:每秒完成的寫次數 rkB/s:每秒讀數據量(kb) wkB/s:每秒寫數據量(kb) avgrq-sz:平均每次IO請求的扇區大小 avgqu-sz:平均每次IO請求的隊列長度(越短越好) await:平均每次IO請求等待時間(毫秒),一般的系統IO等待時間應該低於5ms,如果大於10ms就比較大了。這個時間包括了隊列時間和服務時間,也就是說,一般情況下,await大於svctm,它們的差值越小,則說明隊列時間越短,反之差值越大,隊列時間越長,說明系統出了問題。 r_await:讀的平均耗時(毫秒) w_await:寫入平均耗時(毫秒) svctm:平均每次IO請求處理時間(毫秒),如果svctm的值與await很接近,表示幾乎沒有I/O等待,磁盤性能很好,如果await的值遠高於svctm的值,則表示I/O隊列等待太長,系統上運行的應用程序將變慢。 %util:IO隊列非空比例,該參數暗示了設備的繁忙程度。一般地,如果該參數是100%表示設備已經接近滿負荷運行了 --------------------- 作者:誠寜 來源:CSDN 原文:https://blog.csdn.net/mofiu/article/details/80758358 版權聲明:本文為博主原創文章,轉載請附上博文鏈接!
~~~~~~~~~~~~~~~~以下方法一未監控到數據,有待改進!請用方法二!!~~~~~~~~~~~~~~~~~
方法一:
二:腳本
2.1:創建目錄
mkdir -p /etc/zabbix/zabbix_agentd.d/scripts
2.2:創建磁盤發現腳本
vim disk_discovery.sh
#!/bin/bash
diskarray=(`cat /proc/diskstats |grep -E "\bsd[a-z]\b|\bxvd[a-z]\b|\bvd[a-z]\b"|awk '{print $3}'|sort|uniq  2>/dev/null`)
length=${#diskarray[@]}
printf "{\n"
printf  '\t'"\"data\":["
for ((i=0;i<$length;i++))
do
        printf '\n\t\t{'
        printf "\"{#DISK_NAME}\":\"${diskarray[$i]}\"}"
        if [ $i -lt $[$length-1] ];then
                printf ','
        fi
done
printf  "\n\t]\n"
printf "}\n"
2.3:創建磁盤狀態腳本
#/bin/sh
Device=$1
DISK=$2
case $DISK in
         rrqm)
            iostat -dxkt 1 2|grep "\b$Device\b"|tail -1|awk '{print $2}'
            ;;
         wrqm)
            iostat -dxkt 1 2|grep "\b$Device\b"|tail -1|awk '{print $3}'
            ;;
          rps)
            iostat -dxkt 1 2|grep "\b$Device\b"|tail -1|awk '{print $4}'
            ;;
          wps)
            iostat -dxkt 1 2|grep "\b$Device\b" |tail -1|awk '{print $5}'
            ;;
        rKBps)
            iostat -dxkt 1 2|grep "\b$Device\b" |tail -1|awk '{print $6}'
            ;;
        wKBps)
            iostat -dxkt 1 2|grep "\b$Device\b" |tail -1|awk '{print $7}'
            ;;
        avgrq-sz)
            iostat -dxkt 1 2|grep "\b$Device\b" |tail -1|awk '{print $8}'
            ;;
        avgqu-sz)
            iostat -dxkt 1 2|grep "\b$Device\b" |tail -1|awk '{print $9}'
            ;;
        await)
            iostat -dxkt 1 2|grep "\b$Device\b" |tail -1|awk '{print $10}'
            ;;
        svctm)
            iostat -dxkt 1 2|grep "\b$Device\b" |tail -1|awk '{print $11}'
            ;;
         util)
            iostat -dxkt |grep "\b$Device\b" |tail -1|awk '{print $12}'
            ;;
esac
2.4:修改配置文件
vim /etc/zabbix/zabbix_agentd.conf
### Option: UserParameter
#       User-defined parameter to monitor. There can be several user-defined parameters.
#       Format: UserParameter=<key>,<shell command>
#       See 'zabbix_agentd' directory for examples.
#
# Mandatory: no
# Default:
# UserParameter=
UserParameter=disk.discovery[*],/etc/zabbix/zabbix_agentd.d/scripts/disk_discovery.sh
UserParameter=disk.status[*],/etc/zabbix/zabbix_agentd.d/scripts/disk_status.sh $1 $2
2.5:重啟客戶端服務
systemctl status zabbix-agent
2.6:在服務端驗證腳本運行:
[root@zabbix-01 scripts]# zabbix_get -s 192.168.1.16 -k 'disk.discovery[*]'
[root@zabbix-01 scripts]# zabbix_get -s 192.168.1.16 -k 'disk.discovery[*]'
{
	"data":[
		{"{#DISK_NAME}":"xvda"}
	]
}
三:zabbix控制台添加監控項
3.1:添加模板
配置-模板-創建模板

3.2:創建自動發現規則
管理-模板-sysstat-自動發現規則-創建發現規則


3.3:創建監控項原型
(鍵值[]中的數值必須大寫,否則會報錯)
Cannot create item: item with the same key “diskio.x.[[xxxxxx]] already exists


3.4:創建圖形原型
(名稱后邊要帶哪個磁盤的動態名稱,否則會報錯如下)
zabbix3 Cannot create graph: graph with the same name “Disk IO” already exists

~~~~~~~~~~~~~~~~以上方法一未監控到數據,有待改進!請用方法二!!~~~~~~~~~~~~~~~~~
方法二:
二: 編輯zabbix-agent配置文件
2.1:vim /etc/zabbix/zabbix_agentd.conf
### Option: UserParameter
#       User-defined parameter to monitor. There can be several user-defined parameters.
#       Format: UserParameter=<key>,<shell command>
#       See 'zabbix_agentd' directory for examples.
#
# Mandatory: no
# Default:
# UserParameter=
#UserParameter=disk.discovery[*],/etc/zabbix/zabbix_agentd.d/scripts/disk_discovery.sh
#UserParameter=disk.status[*],/etc/zabbix/zabbix_agentd.d/scripts/disk_status.sh $1 $2
# 磁盤讀的次數
UserParameter=custom.vfs.dev.read.ops[*],cat /proc/diskstats | grep $1 | head -1 | awk '{print $$4}'

# 磁盤讀的毫秒數
UserParameter=custom.vfs.dev.read.ms[*],cat /proc/diskstats | grep $1 | head -1 | awk '{print $$7}'

# 磁盤寫的次數
UserParameter=custom.vfs.dev.write.ops[*],cat /proc/diskstats | grep $1 | head -1 | awk '{print $$8}'

# 磁盤寫的毫秒數
UserParameter=custom.vfs.dev.write.ms[*],cat /proc/diskstats | grep $1 | head -1 | awk '{print $$11}'

# 正在處理的輸入輸出的請求數
UserParameter=custom.vfs.dev.io.active[*],cat /proc/diskstats | grep $1 | head -1 | awk '{print $$12}'

# 花費在IO操作上的毫秒數
UserParameter=custom.vfs.dev.io.ms[*],cat /proc/diskstats | grep $1 | head -1 | awk '{print $$13}'

# 讀扇區的次數(一個扇區的等於512B)
UserParameter=custom.vfs.dev.read.sectors[*],cat /proc/diskstats | grep $1 | head -1 | awk '{print $$6}'

# 寫扇區的次數(一個扇區的等於512B)
UserParameter=custom.vfs.dev.write.sectors[*],cat /proc/diskstats | grep $1 | head -1 | awk '{print $$10}'
2.2:重啟zabbix-agent服務
systemctl restart zabbix-agent
2.3:查看磁盤狀態
cat /proc/diskstats
[root@zabbix-01 zabbix]# cat /proc/diskstats
 202       0 xvda 201575 65 15876154 740040 5853599 8266 106013034 4818683 0 931600 5557837
 202       1 xvda1 28302 0 2372975 124862 56 0 4236 67 0 41897 124919
 202       2 xvda2 146044 65 11180987 565672 3540274 8266 106008798 4731998 0 859899 5296958
  11       0 sr0 0 0 0 0 0 0 0 0 0 0 0
 253       0 dm-0 63023 0 4205685 529218 3973506 0 106001763 4839033 0 884981 5368255
 253       1 dm-1 27293 0 2323776 16105 0 0 0 0 0 5468 16105
 253       2 dm-2 28519 0 2328438 12097 139 0 7035 4569 0 4526 16668
df -h 與 diskstats的關系
cd /dev/mapper
ll
[root@tidb-01 ~]# cd /dev/mapper
[root@tidb-01 mapper]# ll
總用量 0
lrwxrwxrwx. 1 root root       7 2月  23 14:54 centos-ext4 -> ../dm-3
lrwxrwxrwx. 1 root root       7 2月  23 14:54 centos-home -> ../dm-2
lrwxrwxrwx. 1 root root       7 2月  23 14:54 centos-root -> ../dm-0
lrwxrwxrwx. 1 root root       7 2月  23 16:01 centos-swap -> ../dm-1
crw-------. 1 root root 10, 236 2月  23 14:54 control
2.3:測試
zabbix_get -s 192.168.1.6 -p 10050 -k custom.vfs.dev.write.ops[xvda2]
[root@zabbix-01 zabbix]# zabbix_get -s 192.168.1.6 -p 10050 -k custom.vfs.dev.write.ops[xvda2]
3542051
三:添加監控項
3.1:WEB
http://192.168.39.16/zabbix/
3.2:新建模板

3.3:新建應用集

3.4:新建監控項

配置其他監控項:
配置第一個監控項
Name: Disk:$1:Read:Bytes/sec
Key: custom.vfs.dev.read.sectors[sda]
Units: B/sec
Store value: speed per second //會進行差值計算
Use custom multiplier 512 //會對值乘以512,因為這里是一個扇區,轉換為字節為512B
第二監控項:和第一個一樣的配置過程
Name:Disk:$1:Write:Bytes/sec
Key: custom.vfs.dev.write.sectors[sda]
Units: B/sec
Store value: speed per second
Use custom multiplier 512
第三個監控項配置參數
Name:Disk:$1:Read:ops per second
Key: custom.vfs.dev.read.ops[sda]
Units: ops/second
Store value: speed per second
第四個監控項配置參數:
Name: Disk:$1:Write:ops per second
Key: custom.vfs.dev.write.ops[sda]
Units: ops/second
Store value: speed per second
第五個監控項配置參數:
Name: Disk:$1:Read:ms
Key: custom.vfs.dev.read.ms[sda]
Units: ms
Store value: speed per second
第六個監控項配置參數:
Name:Disk:$1:Write:ms
Key: custom.vfs.dev.write.ms[sda]
Units: ms
Store value: speed per second
IO操作的輸入輸出沒有配置監控項,主要監控的是磁盤的讀寫情況,接着添加相應的圖形即可
3.5:添加監控項的進程規則

3.6:新建圖形
3.7:模板添加到主機

3.8:添加監控組件(之前未加秒差值,數值為累計值)

感謝:
https://www.cnblogs.com/w787815/p/7261091.html
https://blog.csdn.net/mofiu/article/details/80758358
https://www.cnblogs.com/helloyb/p/5565999.html