部署ELK Stack
官網:https://www.elastic.co
環境准備:
| ip | hostname | 服務 | 用戶、組 |
|---|---|---|---|
| 192.168.20.3 | node2003 | kibana6.5,filebeat | es |
| 192.168.20.4 | node2004 | elasticsearch 6.5,jdk8 | es |
| 192.168.20.5 | node2005 | elasticsearch 6.5,jdk8 | es |
| 192.168.20.6 | node2006 | elasticsearch 6.5,jdk8 | es |
| 192.168.20.7 | node2007 | logstash-6.5,jdk8 | es |
一、安裝elasticsearch cluster
node2004:
~]# pwd
/usr/local/pkg/
~]# ll
-rw-r--r-- 1 root root 113320120 Dec 21 05:10 elasticsearch-6.5.2.tar.gz
-rw-r--r-- 1 root root 191753373 Dec 21 05:10 jdk-8u191-linux-x64.tar.gz
~]# tar xf jdk-8u191-linux-x64.tar.gz
~]# mv jdk1.8.0_191/ jdk8
~]# tar xf elasticsearch-6.5.2.tar.gz
~]# mv elasticsearch-6.5.2 elasticsearch
~]# cd elasticsearch
~]# mkdir data      //用於存放數據,可掛載一個專門的數據存儲
~]# useradd es
~]# chown -R es.es /usr/local/pkg/elasticsearch  /usr/local/pkg/jdk8    //給這兩個目錄賦權限,程序只使用es用戶維護
編輯配置文件
~]# vim config/elasticsearch.yml
cluster.name: myes
確保不要在不同的環境中重用相同的群集名稱,否則最終會導致節點加入錯誤的集群。cluster.name的值來區分不同的集群。node.name: ${HOSTNAME}
給每個節點設置一個有意義的、清楚的、描述性的名字。node.master: true
用於指定該節點是否竟爭主節點,默認為true。node.data: false
用於指定節點是否存儲數據,默認為true。node.ingest: true
數據預處理功能。類似於logstash的功能。path.data: /usr/local/pkg/elasticsearch/data
數據存儲目錄,建議使用單獨掛載的存儲。path.logs: /usr/local/pkg/elasticsearch/logs
日志存儲目錄bootstrap.memory_lock: true
設置為true時,程序嘗試將進程地址空間鎖定到RAM中,從而防止任何elasticsearch內存被換出。 官方的說法是:交換對性能,節點穩定性非常不利,應該不惜一切代價避免,它可能導致垃圾收集持續數分鍾而不是毫秒,並且可能導致節點響應慢甚至斷開與集群的連接。
注:如果嘗試分配的內存超過可用內存,可能會導致JVM和shell會話退出!
network.host: 192.168.20.4
對外網關IPhttp.port: 9200
對外數據端口discovery.zen.ping.unicast.hosts: ["192.168.20.4:9300", "192.168.20.5:9300","192.168.20.6:9300"]
集群內節點的信息,集群內通信使用tcp9300端口。discovery.zen.minimum_master_nodes: 2
discovery.zen.minimum_master_nodes設定對你的集群的穩定非常重要。當你的集群中有兩個master時,這個配置有助於防止腦裂,一種兩個主節點同時存在於一個集群的現象。
如果你的集群發生了腦裂,那么你的集群就會處在丟失數據的危險中,因為主節點被認為是這個集群的最高統冶者,它決定了什么時候新的索引可以創建,分片是如何移動的等等。如果你有兩個master節點,你的數據的完整性將得不到保證,因為你有兩個節點認為他們有集群的控制權。
這個配置就是告訴elasticsearch當沒有足夠的master候選節點的時候,就不要進行master節點選舉,等master候選節點足夠了才進行選舉。
此值設置應該被配置為master候選節點的法定個數(大多數個)。法定個數就是 "(master候選節點/2)+1"。
如果你有10個節點(都能保存數據,1個master9個候選master),法定個數就是6
如果你有兩個節點,法定個數為2,但是這意味着如果一個節點掛掉,你整個集群就不可用了。設置成1可以保證集群的功能,但是就無法保證集群腦裂。所以,至少保證是奇數個節點。
注: 這里的選舉知識可參考經典的 paxos 協議。
-
gateway.recover_after_nodes: 2
集群中多少個節點啟動后,才允許進行恢復處理。只有在重啟時才會使用這里的配置。假如你有3個節點(都存數據),其中一個主節點。這時你需要將集群離線維護。維護好后將3台機器重啟,有兩台非master機器先啟動好了,master機器無法啟動。那這時先啟動好的兩機器等待一個時間周期后,重新選舉。選舉后新的master發現數據不再均勻分布。因為其中一個機器的數據丟失了,所以他們之間會立即啟動分片復制。這里值的設定看個人喜好,如果有幾個節點就設幾的話,就失去選舉功能了,並且一但master宕機,不修復就無法對外提供服務的可能。 -
action.destructive_requires_name: true
用於刪除索引時需要明確給出索引名稱,默認為true
這里的配置只是其中一部分,詳細配置請參考官方說明:https://www.elastic.co/guide/cn/elasticsearch/guide/current/important-configuration-changes.html
修改系統變量
1 文件描述符:
編輯/etc/security/limits.conf文件為特定用戶設置持久限制。要將用戶的最大打開文件數設置elasticsearch為65535,服務啟動前添加如下配置:
~]# echo "es - nofile 65535" >> /etc/security/limits.conf
2 虛擬內存:
Elasticsearch mmapfs默認使用目錄來存儲其索引。mmap計數的默認操作系統限制可能太低,這可能導致內存不足異常。
添加如下配置,並重啟后生效
~]# echo "vm.max_map_count = 262144" >> /usr/lib/sysctl.d/50-default.conf
3 線程數:
Elasticsearch為不同類型的操作使用了許多線程池。重要的是它能夠在需要時創建新線程。確保Elasticsearch用戶可以創建的線程數至少為4096。服務啟動前添加如下配置:
~]# echo "es - nproc 4096" >> /etc/security/limits.conf
啟動服務腳本
[Unit]
Description=Elasticsearch
Wants=network-online.target
After=network-online.target

[Service]
Type=simple
PrivateTmp=true
Environment=ES_HOME=/usr/local/pkg/elasticsearch
Environment=ES_PATH_CONF=/usr/local/pkg/elasticsearch/config
Environment=PID_DIR=/var/run/elasticsearch

WorkingDirectory=/usr/local/pkg/elasticsearch

User=es
Group=es

ExecStart=/usr/local/pkg/elasticsearch/bin/elasticsearch
StandardOutput=journal
StandardError=inherit
# Specifies the maximum file descriptor number that can be opened by this process
LimitNOFILE=65536

# Specifies the maximum number of processes
LimitNPROC=4096

# Specifies the maximum size of virtual memory
LimitAS=infinity

# Specifies the maximum file size
LimitFSIZE=infinity

# Disable timeout logic and wait until process is stopped
TimeoutStopSec=0

# SIGTERM signal is used to stop the Java process
KillSignal=SIGTERM

# Send the signal only to the JVM rather than its control group
KillMode=process

# Java process is never killed
SendSIGKILL=no

# When a JVM receives a SIGTERM signal it exits with code 143
SuccessExitStatus=143

[Install]
WantedBy=multi-user.target
elasticsearch需要jdk8,防止系統內其它版本混亂,可在啟動腳本中添加相應環境變量
~]# vim /usr/local/pkg/elasticsearch/bin/elasticsearch
#!/bin/bash

# CONTROLLING STARTUP:
#
# This script relies on a few environment variables to determine startup
# behavior, those variables are:
#
#   ES_PATH_CONF -- Path to config directory
#   ES_JAVA_OPTS -- External Java Opts on top of the defaults set
#
# Optionally, exact memory values can be set using the `ES_JAVA_OPTS`. Note that
# the Xms and Xmx lines in the JVM options file must be commented out. Example
# values are "512m", and "10g".
#
#   ES_JAVA_OPTS="-Xms8g -Xmx8g" ./bin/elasticsearch
ES_PATH_CONFIG=/usr/local/pkg/elasticsearch/config
export JAVA_HOME=/usr/local/pkg/jdk8
export PATH=$JAVA_HOME/bin:$PATH
export CLASSPATH=.:$JAVA_HOME/lib/dt.jar:$JAVA_HOME/lib/tools.jar
//在啟動腳本前添加jdk環境變量,這樣程序專門指定相應jdk
**啟動服務:** ``` ~]# systemctl daemon-reload ~]# systemctl start elasticsearch.service ~]# ps -ef | grep ela //查看進程 root 10806 10789 0 09:54 pts/1 00:00:00 vim bin/elasticsearch es 11635 1 3 10:35 ? 00:00:26 /usr/local/pkg/jdk8/bin/java -Xms1g -Xmx1g -XX:+UseConcMarkSweepGC -XX:CMSInitiatingOccupancyFraction=75 -XX:+UseCMSInitiatingOccupancyOnly -XX:+AlwaysPreTouch -Xss1m -Djava.awt.headless=true -Dfile.encoding=UTF-8 -Djna.nosys=true -XX:-OmitStackTraceInFastThrow -Dio.netty.noUnsafe=true -Dio.netty.noKeySetOptimization=true -Dio.netty.recycler.maxCapacityPerThread=0 -Dlog4j.shutdownHookEnabled=false -Dlog4j2.disable.jmx=true -Djava.io.tmpdir=/tmp/elasticsearch.hTwfw2vY -XX:+HeapDumpOnOutOfMemoryError -XX:HeapDumpPath=data -XX:ErrorFile=logs/hs_err_pid%p.log -XX:+PrintGCDetails -XX:+PrintGCDateStamps -XX:+PrintTenuringDistribution -XX:+PrintGCApplicationStoppedTime -Xloggc:logs/gc.log -XX:+UseGCLogFileRotation -XX:NumberOfGCLogFiles=32 -XX:GCLogFileSize=64m -Des.path.home=/usr/local/pkg/elasticsearch -Des.path.conf=/usr/local/pkg/elasticsearch/config -Des.distribution.flavor=default -Des.distribution.type=tar -cp /usr/local/pkg/elasticsearch/lib/* org.elasticsearch.bootstrap.Elasticsearch es 11688 11635 0 10:35 ? 00:00:00 /usr/local/pkg/elasticsearch/modules/x-pack-ml/platform/linux-x86_64/bin/controller root 12281 12141 0 10:46 pts/4 00:00:00 grep --color=auto ela
查看日志輸出情況
~]# tail -f /usr/local/pkg/elasticsearch/logs/myes.log
[2018-12-22T10:19:54,669][INFO ][o.e.e.NodeEnvironment ] [node2004] using [1] data paths, mounts [[/ (rootfs)]], net usable_space [43.1gb], net total_space [45gb], types [rootfs]
[2018-12-22T10:19:54,672][INFO ][o.e.e.NodeEnvironment ] [node2004] heap size [1007.3mb], compressed ordinary object pointers [true]
[2018-12-22T10:19:54,673][INFO ][o.e.n.Node ] [node2004] node name [node2004], node ID [TN_N06ovT8ufWPkOYR0Esg]
[2018-12-22T10:19:54,674][INFO ][o.e.n.Node ] [node2004] version[6.5.2], pid[10935], build[default/tar/9434bed/2018-11-29T23:58:20.891072Z], OS[Linux/3.10.0-862.el7.x86_64/amd64], JVM[Oracle Corporation/Java HotSpot(TM) 64-Bit Server VM/1.8.0_191/25.191-b12]
[2018-12-22T10:19:54,674][INFO ][o.e.n.Node ] [node2004] JVM arguments [-Xms1g, -Xmx1g, -XX:+UseConcMarkSweepGC, -XX:CMSInitiatingOccupancyFraction=75, -XX:+UseCMSInitiatingOccupancyOnly, -XX:+AlwaysPreTouch, -Xss1m, -Djava.awt.headless=true, -Dfile.encoding=UTF-8, -Djna.nosys=true, -XX:-OmitStackTraceInFastThrow, -Dio.netty.noUnsafe=true, -Dio.netty.noKeySetOptimization=true, -Dio.netty.recycler.maxCapacityPerThread=0, -Dlog4j.shutdownHookEnabled=false, -Dlog4j2.disable.jmx=true, -Djava.io.tmpdir=/tmp/elasticsearch.z1Ja46qO, -XX:+HeapDumpOnOutOfMemoryError, -XX:HeapDumpPath=data, -XX:ErrorFile=logs/hs_err_pid%p.log, -XX:+PrintGCDetails, -XX:+PrintGCDateStamps, -XX:+PrintTenuringDistribution, -XX:+PrintGCApplicationStoppedTime, -Xloggc:logs/gc.log, -XX:+UseGCLogFileRotation, -XX:NumberOfGCLogFiles=32, -XX:GCLogFileSize=64m, -Des.path.home=/usr/local/pkg/elasticsearch, -Des.path.conf=/usr/local/pkg/elasticsearch/config, -Des.distribution.flavor=default, -Des.distribution.type=tar]
[2018-12-22T10:19:56,833][INFO ][o.e.p.PluginsService ] [node2004] loaded module [aggs-matrix-stats]
...
[2018-12-22T10:20:03,620][INFO ][o.e.n.Node ] [node2004] initialized
[2018-12-22T10:20:03,620][INFO ][o.e.n.Node ] [node2004] starting ...
[2018-12-22T10:20:03,762][INFO ][o.e.t.TransportService ] [node2004] publish_address {192.168.20.4:9300}, bound_addresses {192.168.20.4:9300}
[2018-12-22T10:20:03,783][INFO ][o.e.b.BootstrapChecks ] [node2004] bound or publishing to a non-loopback address, enforcing bootstrap checks
[2018-12-22T10:20:06,829][WARN ][o.e.d.z.ZenDiscovery ] [node2004] not enough master nodes discovered during pinging (found [[Candidate{node={node2004}{TN_N06ovT8ufWPkOYR0Esg}{SCIJSvtyTQOp9XOfBQiTsw}{192.168.20.4}{192.168.20.4:9300}{ml.machine_memory=3974492160, xpack.installed=true, ml.max_open_jobs=20, ml.enabled=true}, clusterStateVersion=-1}]], but needed [2]), pinging again
[2018-12-22T10:20:09,830][WARN ][o.e.d.z.ZenDiscovery ] [node2004] not enough master nodes discovered during pinging (found [[Candidate{node={node2004}{TN_N06ovT8ufWPkOYR0Esg}{SCIJSvtyTQOp9XOfBQiTsw}{192.168.20.4}{192.168.20.4:9300}{ml.machine_memory=3974492160, xpack.installed=true, ml.max_open_jobs=20, ml.enabled=true}, clusterStateVersion=-1}]], but needed [2]), pinging again
//因為另外兩個節點沒有啟動,所以服務無法發現,也就無法對外提供服務。
####配置node2005和node2006:
修改`network.host:`為本機IP,`node.master`和`node.data`都為true。其它配置不變,並啟動。
<br />

查看nood2005機器的日志:
~]# tail -f /usr/local/pkg/elasticsearch/logs/myes.log
[2018-12-23T22:22:52,880][INFO ][o.e.p.PluginsService ] [node2005] loaded module [x-pack-monitoring]
[2018-12-23T22:22:52,880][INFO ][o.e.p.PluginsService ] [node2005] loaded module [x-pack-rollup]
[2018-12-23T22:22:52,880][INFO ][o.e.p.PluginsService ] [node2005] loaded module [x-pack-security]
[2018-12-23T22:22:52,880][INFO ][o.e.p.PluginsService ] [node2005] loaded module [x-pack-sql]
[2018-12-23T22:22:52,881][INFO ][o.e.p.PluginsService ] [node2005] loaded module [x-pack-upgrade]
[2018-12-23T22:22:52,881][INFO ][o.e.p.PluginsService ] [node2005] loaded module [x-pack-watcher]
[2018-12-23T22:22:52,881][INFO ][o.e.p.PluginsService ] [node2005] no plugins loaded
[2018-12-23T22:22:57,405][INFO ][o.e.x.s.a.s.FileRolesStore] [node2005] parsed [0] roles from file [/usr/local/pkg/elasticsearch/config/roles.yml]
[2018-12-23T22:22:57,875][INFO ][o.e.x.m.j.p.l.CppLogMessageHandler] [node2005] [controller/3587] [Main.cc@109] controller (64 bit): Version 6.5.2 (Build 767566e25172d6) Copyright (c) 2018 Elasticsearch BV
[2018-12-23T22:22:58,612][DEBUG][o.e.a.ActionModule ] [node2005] Using REST wrapper from plugin org.elasticsearch.xpack.security.Security
[2018-12-23T22:22:58,894][INFO ][o.e.d.DiscoveryModule ] [node2005] using discovery type [zen] and host providers [settings]
[2018-12-23T22:22:59,737][INFO ][o.e.n.Node ] [node2005] initialized
[2018-12-23T22:22:59,738][INFO ][o.e.n.Node ] [node2005] starting ...
[2018-12-23T22:22:59,879][INFO ][o.e.t.TransportService ] [node2005] publish_address {192.168.20.5:9300}, bound_addresses {192.168.20.5:9300}
[2018-12-23T22:22:59,900][INFO ][o.e.b.BootstrapChecks ] [node2005] bound or publishing to a non-loopback address, enforcing bootstrap checks
[2018-12-23T22:23:03,259][INFO ][o.e.c.s.ClusterApplierService] [node2005] detected_master {node2006}{2iH5BLMbT3eTi6Tm8ysyNg}{zQkibzjOQk-jbe2cZNOiow}{192.168.20.6}{192.168.20.6:9300}{ml.machine_memory=3974492160, ml.max_open_jobs=20, xpack.installed=true, ml.enabled=true}, added {{node2006}{2iH5BLMbT3eTi6Tm8ysyNg}{zQkibzjOQk-jbe2cZNOiow}{192.168.20.6}{192.168.20.6:9300}{ml.machine_memory=3974492160, ml.max_open_jobs=20, xpack.installed=true, ml.enabled=true},{node2004}{TN_N06ovT8ufWPkOYR0Esg}{4RjuzapkTs2Gy5q8bZGIkQ}{192.168.20.4}{192.168.20.4:9300}{ml.machine_memory=3974492160, ml.max_open_jobs=20, xpack.installed=true, ml.enabled=true},}, reason: apply cluster state (from master [master {node2006}{2iH5BLMbT3eTi6Tm8ysyNg}{zQkibzjOQk-jbe2cZNOiow}{192.168.20.6}{192.168.20.6:9300}{ml.machine_memory=3974492160, ml.max_open_jobs=20, xpack.installed=true, ml.enabled=true} committed version [23]])
//從上一條日志可以得到node2005通過連接查詢得到node2006為master,並且與node2005機器進行了友好通信
[2018-12-23T22:23:03,533][WARN ][o.e.x.s.a.s.m.NativeRoleMappingStore] [node2005] Failed to clear cache for realms [[]]
[2018-12-23T22:23:03,537][INFO ][o.e.x.s.a.TokenService ] [node2005] refresh keys
[2018-12-23T22:23:03,893][INFO ][o.e.x.s.a.TokenService ] [node2005] refreshed keys
[2018-12-23T22:23:03,934][INFO ][o.e.l.LicenseService ] [node2005] license [4c39dc4c-1abb-4b60-bcd8-eed218f217b5] mode [basic] - valid
[2018-12-23T22:23:03,966][INFO ][o.e.x.s.t.n.SecurityNetty4HttpServerTransport] [node2005] publish_address {192.168.20.5:9200}, bound_addresses {192.168.20.5:9200}
[2018-12-23T22:23:03,967][INFO ][o.e.n.Node ] [node2005] started
這時候elasticsearch cluster已經建立OK,接下來就可以安裝kibana和logstash以及filebeat。


##二、 安裝kibana
**配置kibana.yml**
//解壓
~]# cd /usr/local/pkg/
~]# tar xf kibana-6.5.2-linux-x86_64.tar.gz
~]# mv kibana-6.5.2-linux-x86_64 kibana
~]# cd kibana
~]# vim /etc/profile.d/kibana.sh //添加環境變量
export PATH=/usr/local/pkg/kibana/bin:$PATH
~]# source /etc/profile.d/kibana.sh
//編輯
~]# vim config/kibana.yml
...
配置文件中重要參數含義:
* `server.port: 5601`
默認端口號:5601
* `server.host: "localhost"`
默認值:"localhost",即指定后端服務器的主機地址
* `elasticsearch.url: "http://192.168.20.4:9200"`
用來處理所有查詢的elasticsearch實例的URL。
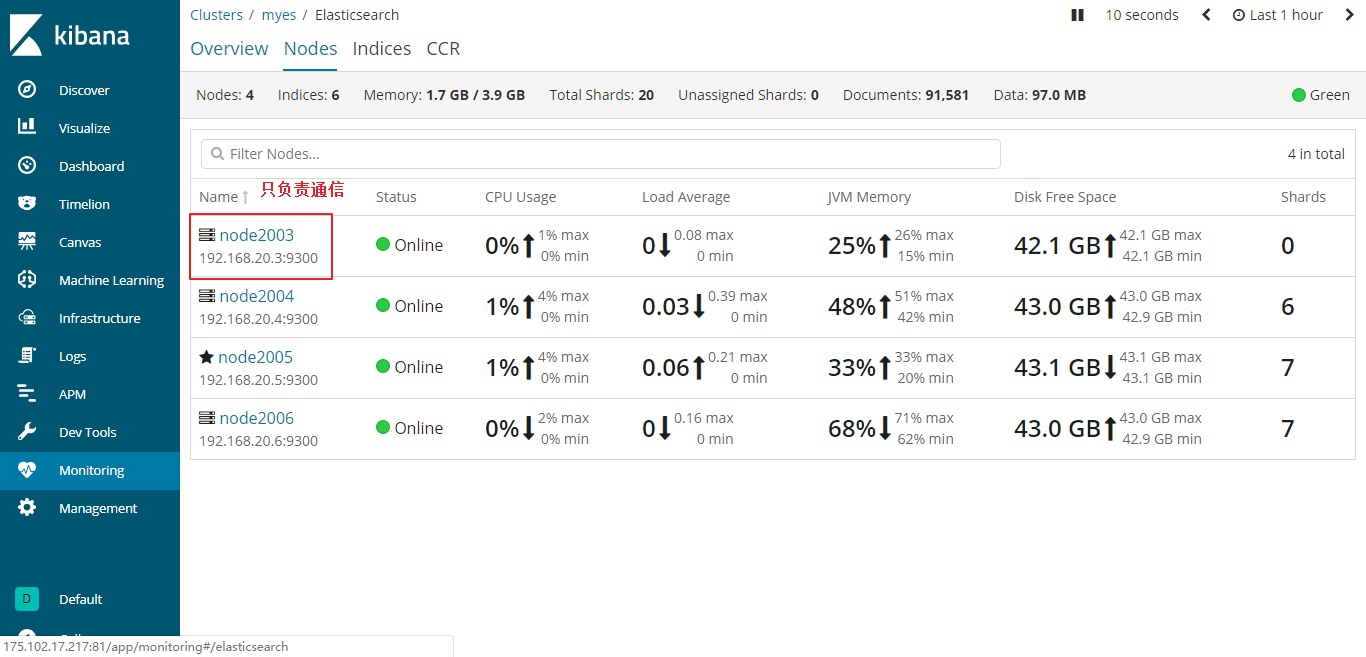
>這里的elasticsearch.url只能填寫一個url,那這里該怎么連接es cluster呢?根據官方可出的解決方法,可以在kibana主機上部署一個elasticsearch只做通信,只需要把`node.data:false`,`node.master:false`,`node.ingest:false` 其它配置一樣即可。
* `server.name: "node2003"
kibana實例對外展示的名稱
* `kibana.index: ".kibana"`
kibana使用elasticsearch中的索引來存儲保存的檢索,可視化控件以及儀表板。如果沒有索引,kibana會創建一個新的索引
* `tilemap.url:`
用來在地圖可視化組件中展示地圖服務的URL。可使用自己的地圖地址。如高德地圖URL:'http://webrd02.is.autonavi.com/appmaptile?lang=zh_cn&size=1&scale=1&style=7&x={x}&y={y}&z={z}'
* `elasticsearch.username:`和`elasticsearch.password:`
elasticsearch設置了基本的權限認證,該配置提供了用戶名和密碼,用於kibana啟動時維護索引。
* `server.ssl.enabled: false`、`server.ssl.certificate: `、`server.ssl.key: `
對到瀏覽器端的請求啟用SSL,設為true時,server.ssl.certificat和server.ssl.key也要設置。
* `elasticsearch.ssl.certificate: `、`elasticsearch.ssl.key: `
可配置選項,提供PEM格式SSL證書和密鑰文件的路徑。這些文件確保elasticsearch后端使用同校樣的密鑰文件。
* `elasticsearch.pingTimeout:`
elasticsearch ping狀態的響應時間,判斷elasticsearch狀態
* `elasticsearch.requestTimeout:`
elasticsearch響應時間,單位毫秒。
* `elasticsearch.shardTimeout :`
等待來自分片的響應時間(以毫秒為單位)。0為禁用
* `elasticsearch.startupTimeout:`
kibana啟動時等待elasticsearch的時間。
* `elasticsearch.logQueries: false`
記錄發送到時elasticsearch的查詢。
* `pid.file: /var/run/kibana.pid`
指定kibana的進程ID文件的路徑
* `logging.dest: /usr/local/pkg/kibana/logs/kibana.log`
指定輸出的方式。stdout標准輸出,也可/path/to/xxx.log輸出至文件中
* `logging.silent: false`
是否輸出日志,true為不輸出日志,false為輸出日志
* `logging.quiet: true`
靜默模式,禁止除錯誤外的所有日志輸出。
* `logging.verbose: false`
記下的所有事件包括系統使用信息和所有請求的日志。
* `ops.interval`
設置采樣系統和流程性能的時間間隔,最小值為100(單位毫秒)
* `i18n.locale: "zh_CN"
使用中文輸出,可不是漢化,詳細信息github上有。
**啟動服務腳本**
~]# cat /usr/lib/systemd/system/kibana.service
[Unit]
Description=Kibana
After=network.target remote-fs.target nss-lookup.target
[Service]
Type=simple
PIDFile=/var/run/kibana.pid
User=es
Group=es
Load env vars from /etc/default/ and /etc/sysconfig/ if they exist.
Prefixing the path with '-' makes it try to load, but if the file doesn't
exist, it continues onward.
EnvironmentFile=-/usr/local/pkg/kibana/config/kibana
ExecStart=/usr/local/pkg/kibana/bin/kibana serve
Restart=always
WorkingDirectory=/usr/local/pkg/kibana
[Install]
WantedBy=multi-user.target
**啟動**
kibana]# systemctl daemon-reload
kibana]# mkdir logs
kibana]# useradd es
kibana]# chown -R es.es /usr/local/pkg/kibana
kibana]# systemctl start kibana.service
//查看日志,如果沒有日志則說明正常啟動,因為配置文件中禁止正常日志輸出了,只允許錯誤日志輸出。測試時建議打開。
kibana]# tail -f /usr/local/pkg/kibana/log/kibana.log
....
##三、安裝filebeat
> 輕量采集器,將各種所需要的數據采集后發送給各種存儲或直接發送給數據處理工具(logstash,es)。占用資源量小。
~]# cd /usr/local/pkg/
~]# tar xf filebeat-6.5.2-linux-x86_64.tar.gz && mv filebeat-6.5.2-linux-x86_64 filebeat
~]# vim filebeat/filebeat.yml //這里的配置文件就簡單說下,具體如何配置以實現自己想要的功能,可參考官網較好。
- type: log
//類型logChange to true to enable this input configuration.
enabled: true
//打開input配置Paths that should be crawled and fetched. Glob based paths.
paths:- /var/log/nginx/access.log
- c:\programdata\elasticsearch\logs*
//讀取日志的路徑,可使用通配符匹配
....
----------------------------- Logstash output --------------------------------
output.logstash:
The Logstash hosts
hosts: ["node2007:5044"]
//輸出至logstash上,進行深度處理
....
~]# mkdir filebeat/logs
~]# chown -R es.es /usr/local/pkg/filebeat
2. 添加啟動腳本
~]# vim /usr/lib/systemd/system/filebeat.service
[Unit]
Description=filebeat
After=network.target remote-fs.target nss-lookup.target
[Service]
Type=simple
PIDFile=/usr/local/pkg/filebeat/filebeat.pid
User=es
Group=es
ExecStart=/usr/local/pkg/filebeat/filebeat -c /usr/local/pkg/filebeat/filebeat.yml
Restart=always
WorkingDirectory=/usr/local/pkg/filebeat
[Install]
WantedBy=multi-user.target
~]# systemctl daemon-reload
~]# systemctl start filebeat
##四、安裝logstash
>Logstash 是開源的服務器端數據處理管道,能夠同時從多個來源采集數據,轉換數據。


logstash配置文件簡單解釋:
~]# cd /usr/local/pkg/
~]# tar xf jdk-8u191-linux-x64.tar.gz
~]# mv jdk1.8.0_191/ jdk8
~]# tar xf logstash-6.5.2.tar.gz
~]# mv logstash-6.5.2 logstash
~]# vim logstash/config/logstash.yml
node.name: test
//默認:機器主機名
path.data: /usr/loca/pkg/logstash/data
//存儲相關數據
pipeline.id: main
//管道的ID
pipeline.workers: 2
//並行執行的管道數量,默認主機CPU核心數(處理能力,類似nginx worker)。
pipeline.batch.size: 125
//每次input數量
pipeline.batch.delay: 50
//分發batch到filters和workers之間最長等待的時間。
pipeline.unsafe_shutdown: false
//和kill pid 與kill -9 pid 一個意思。就是當關閉進程時,如果進程手頭上還有事做,那就讓其做完,在關閉。如果為true,就是說關閉不管手頭有沒有事情在做都強制關閉。建議默認false即可。
path.config: /usr/local/pkg/logstash/conf.d/*.conf
//配置文件或文件夾,可使用通配符,配置文件順序按字母順序讀取
config.test_and_exit: false
//啟動時檢查配置文件是否有效並退出。grok patterns不會被檢查。默認false
config.reload.automatic: false
//設置為true時,會周期性檢查配置是否發生了更改並reload,也可手動發送SIGHUP信號來reload
config.reload.interval: 3s
//重讀配置間隔,默認3秒
config.debug: false
//設置為true,會顯示所有debug日志(同時開啟log.level:debug才生效)。注意:為true會將傳遞給插件的密碼顯示出來。
config.support_escapes: false
//設置為true時,將支持\n,\r,\t,\,,",'轉義
------------ Module Settings ---------------
modules:
- name: MODULE_NAME
var.PLUGINTYPE1.PLUGINNAME1.KEY1: VALUE
var.PLUGINTYPE1.PLUGINNAME1.KEY2: VALUE
var.PLUGINTYPE2.PLUGINNAME1.KEY1: VALUE
var.PLUGINTYPE3.PLUGINNAME3.KEY1: VALUE
Module variable names must be in the format of
var.PLUGIN_TYPE.PLUGIN_NAME.KEY
modules:
//配置模塊如上格式
------------ Queuing Settings --------------
queue.type: memory
//用於事件緩沖的內部隊列,memory保存在內存中,persisted持久是基於磁盤的隊列。
path.queue:
//如果queue.type: persisted,則這里需要給定路徑存儲
queue.page_capacity: 64mb
//啟用持久隊列時使用的的頁面數據文件大小。
queue.max_events: 0
//啟用持久隊列時隊列中未讀事件的最大數量為0(無限制)
queue.max_bytes: 1024mb
//隊列的總容量
queue.checkpoint.acks: 1024
//啟用持久隊列時強制檢查點最大ack,0為無限制
queue.checkpoint.writes: 1024
//啟用持久隊列時強制檢查點之前寫入的最大數量。0為無限制
queue.checkpoint.interval: 1000
//檢查間隔
------------ Dead-Letter Queue Settings --------------
dead_letter_queue.enable: false
dead_letter_queue.max_bytes: 1024mb
path.dead_letter_queue:
//死信隊列(Dead Letter Queue)本質上同普通的Queue沒有區別,只是它的產生是為了隔離和分析其他Queue(源Queue)未成功處理的消息。
------------ Metrics Settings --------------
http.host: "127.0.0.1"
//標准REST端點的綁定地址
http.port: 9600-9700
//標准REST端點綁定端口
------------ Debugging Settings --------------
Options for log.level:
* fatal
* error
* warn
* info (default)
* debug
* trace
log.level: info
path.logs:
//日志級別,默認info
------------ Other Settings --------------
Where to find custom plugins
path.plugins: []
//自定義插件
startup.options配置文件簡單解釋:
~]# vim logstash/config/startup.options
JAVACMD=/usr/local/pkg/jdk8/bin/java
//本地jdk
LS_HOME=/usr/local/pkg/logstash
//logstash所在目錄
LS_SETTINGS_DIR=/usr/local/pkg/logstash/config
//默認logstash.yml所在目錄
LS_OPTS="--path.settings ${LS_SETTINGS_DIR}"
//logstash啟動命令參數,指定配置文件目錄
LS_JAVA_OPTS=""
//java參數
LS_PIDFILE=/var/run/logstash.pid
//logstash pid文件路徑
LS_USER=es
LS_GROUP=es
//啟動用戶和用戶組
LS_GC_LOG_FILE=/usr/local/pkg/logstash/logs/gc.log
//gc日志
LS_OPEN_FILES=16384
//文件句柄
Nice level
LS_NICE=19
//沒找到相應解釋,誰知道啥意思,分享下,感謝!
SERVICE_NAME="logstash"
SERVICE_DESCRIPTION="logstash"
//程序名稱及程序描述
官方配置文件解釋:https://www.elastic.co/guide/en/logstash/6.5/logstash-settings-file.html


<br />
#### 標准nginx日志的pipeline
logstash有大量要學習的知識,這里先簡單將整個集群展示出來。后面一點點寫。
~]# mkdir logstash/{data,logs,conf.d,patterns} -p
~]# vim logstash/conf.d/local_file.conf
input {
beats {
port => 5044
#監聽filebeat端口
}
}
輸入
filter {
grok {
match => {
patterns_dir => ["/usr/local/pkg/logstash/patterns"]
#正則表達式單獨寫入單獨目錄下,這樣方便修改
"message" => "%{OTHERNGINXLOG}"
#使用正則匹配nginx日志,並將每個值抽取出來。
}
}
}
過濾
output {
elasticsearch {
hosts => ["http://192.168.20.6:9200","http://192.168.20.5:9200","http://192.168.20.4:9200"]
#es cluster
index => "logstash-nginx"
#索引名稱
}
}
輸出給elasticsearch進行保存
~]# vim logstash/patterns/nginx
OTHERNGINXLOG %{IPORHOST:clientip} %{USER:ident} %{USER:auth} [%{HTTPDATE:timestamp}] "(?:%{WORD:verb} %{NOTSPACE:request}(?: HTTP/%{NUMBER:httpversion})?|%{DATA:rawrequest})" %{NUMBER:response} (?:%{NUMBER:bytes}|-)
<br />
**添加啟動腳本**
[Unit]
Description=logstash
After=network.target remote-fs.target nss-lookup.target
[Service]
Type=simple
PIDFile=/var/run/logstash.pid
User=es
Group=es
ExecStart=/usr/local/pkg/logstash/bin/logstash -f /usr/local/pkg/logstash/conf.d/*.conf
Restart=always
WorkingDirectory=/usr/local/pkg/logstash
[Install]
WantedBy=multi-user.target
<br />
**啟動服務**
//logstash也依賴jdk8,為了不使用系統jdk環境混亂,我們還是在啟動腳本里添加相應jdk環境變量
~]# vim /usr/loca/pkg/logstash/bin/logstash
!/bin/bash
export JAVA_HOME=/usr/local/pkg/jdk8
export PATH=$JAVA_HOME/bin:$PATH
export CLASSPATH=.:$JAVA_HOME/lib/dt.jar:$JAVA_HOME/lib/tools.jar
...
~]# chown -R es.es /usr/loca/pkg/jdk8 /usr/local/pkg/logstash
~]# systemctl daemon-reload
~]# systemctl start logstash.service
~]# tail -f logstash/logs/logstash-plain.log
[2018-12-24T17:18:08,809][INFO ][logstash.outputs.elasticsearch] ES Output version determined {:es_version=>6}
[2018-12-24T17:18:08,812][WARN ][logstash.outputs.elasticsearch] Detected a 6.x and above cluster: the type event field won't be used to determine the document _type {:es_version=>6}
[2018-12-24T17:18:08,834][INFO ][logstash.outputs.elasticsearch] New Elasticsearch output {:class=>"LogStash::Outputs::ElasticSearch", :hosts=>["http://192.168.20.6:9200"]}
[2018-12-24T17:18:08,866][INFO ][logstash.outputs.elasticsearch] Using mapping template from {:path=>nil}
[2018-12-24T17:18:08,917][INFO ][logstash.outputs.elasticsearch] Attempting to install template {:manage_template=>{"template"=>"logstash-", "version"=>60001, "settings"=>{"index.refresh_interval"=>"5s"}, "mappings"=>{"default"=>{"dynamic_templates"=>[{"message_field"=>{"path_match"=>"message", "match_mapping_type"=>"string", "mapping"=>{"type"=>"text", "norms"=>false}}}, {"string_fields"=>{"match"=>"", "match_mapping_type"=>"string", "mapping"=>{"type"=>"text", "norms"=>false, "fields"=>{"keyword"=>{"type"=>"keyword", "ignore_above"=>256}}}}}], "properties"=>{"@timestamp"=>{"type"=>"date"}, "@version"=>{"type"=>"keyword"}, "geoip"=>{"dynamic"=>true, "properties"=>{"ip"=>{"type"=>"ip"}, "location"=>{"type"=>"geo_point"}, "latitude"=>{"type"=>"half_float"}, "longitude"=>{"type"=>"half_float"}}}}}}}}
[2018-12-24T17:18:09,397][INFO ][logstash.inputs.beats ] Beats inputs: Starting input listener {:address=>"0.0.0.0:5044"}
[2018-12-24T17:18:09,467][INFO ][logstash.pipeline ] Pipeline started successfully {:pipeline_id=>"main", :thread=>"#<Thread:0x423f2fad run>"}
[2018-12-24T17:18:09,540][INFO ][logstash.agent ] Pipelines running {:count=>1, :running_pipelines=>[:main], :non_running_pipelines=>[]}
[2018-12-24T17:18:09,587][INFO ][org.logstash.beats.Server] Starting server on port: 5044
[2018-12-24T17:18:09,835][INFO ][logstash.agent ] Successfully started Logstash API endpoint {:port=>9600}
看到如下信息,說明啟動成功了
<br/><br/>
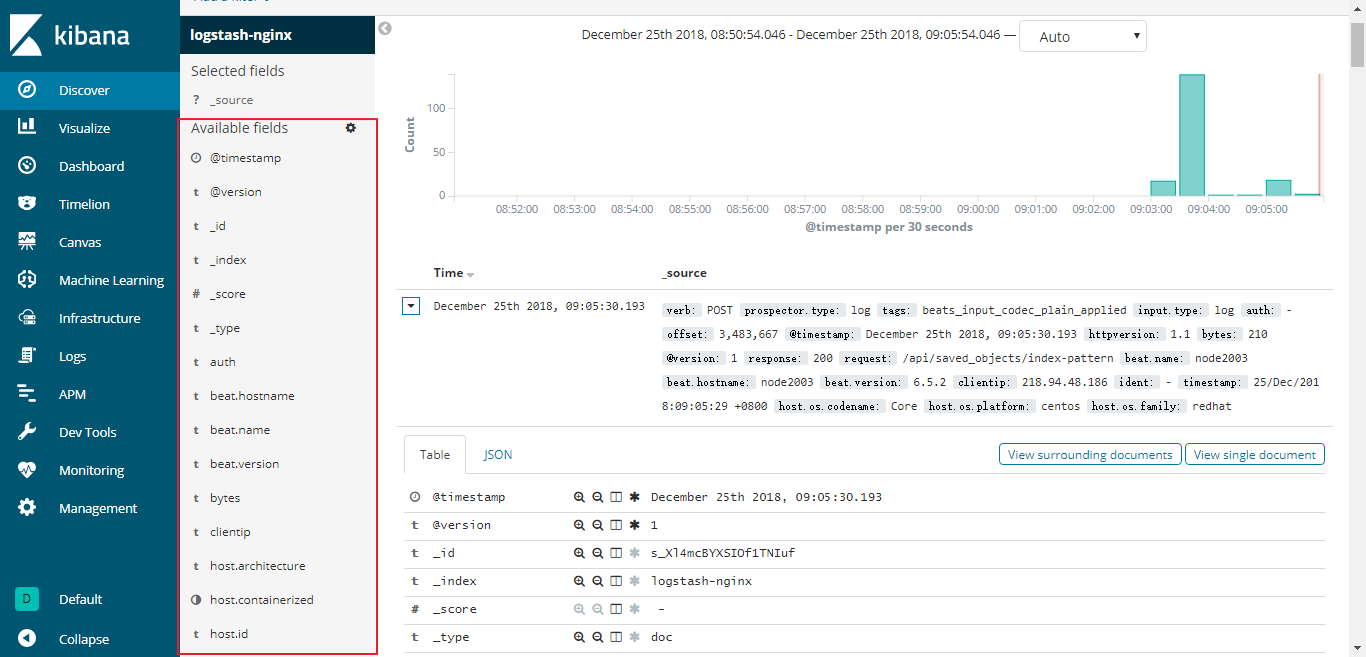
###展示效果
所有服務都已經成功安裝完成並啟動,接下來訪問kibana來查看最后效果。