最近有个需求需要画如下的图:

这些图的核心意思是一样的,就是connection,把不同的数据连到一起。
文章里把这图叫做共线性图,是按功能命名的,Google里搜不到。
搜到类似的,这个图叫 Parallel Coordinates Plot,但显然有些丑陋。
Parallel Coordinates Plot in R
origin里把它叫做Parallel plot,显然快接近我想要的了。
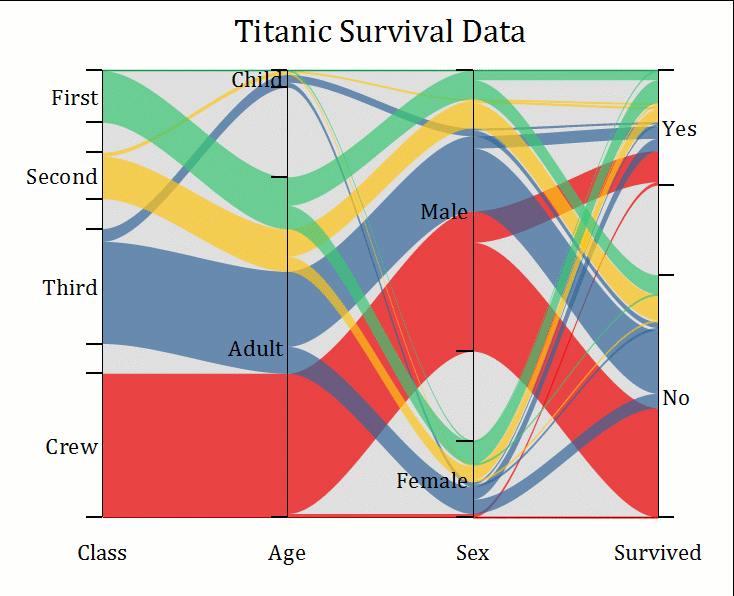
最终根据Google image的类似推送,终于找到了ggplot版本的这个图,叫做Alluvial Diagrams
参考:
Early allopolyploid evolution in the post-Neolithic Brassica napus oilseed genome - 基因组文章,里面有raw的共线性图
用这个工具你也能画出CNS级别的共线性图